Hands-On Spatial Data Science with R: In a world increasingly defined by data, the power of spatial information is undeniable. Every day, countless decisions are shaped by our understanding of where things are located and how they relate to one another. Spatial data science, the art of extracting insights from location-based data, has emerged as a critical tool in fields ranging from urban planning to epidemiology.
A Digital Cartographer’s Toolbox: The Role of R
At the heart of spatial data science lies R, a powerful programming language and environment for statistical computing and graphics. While R is renowned for its versatility in data analysis, its capabilities extend seamlessly to spatial data through specialized packages and libraries.
Setting the Stage: Understanding Spatial Data
Before delving into the intricacies of spatial data science with R, it’s essential to grasp the fundamentals. Spatial data comes in many forms, from simple coordinates to complex geometries representing everything from points of interest to entire regions. Understanding the structure and nuances of spatial data is crucial for effective analysis.
The Dance of Data: Manipulating Spatial Data with R
With R as our guide, we embark on a journey of discovery through the world of spatial data. Through a series of elegant commands and functions, R allows us to manipulate and transform spatial data with ease. Whether we’re merging datasets, performing spatial joins, or conducting geometric operations, R provides the tools we need to unlock the hidden insights within our data.
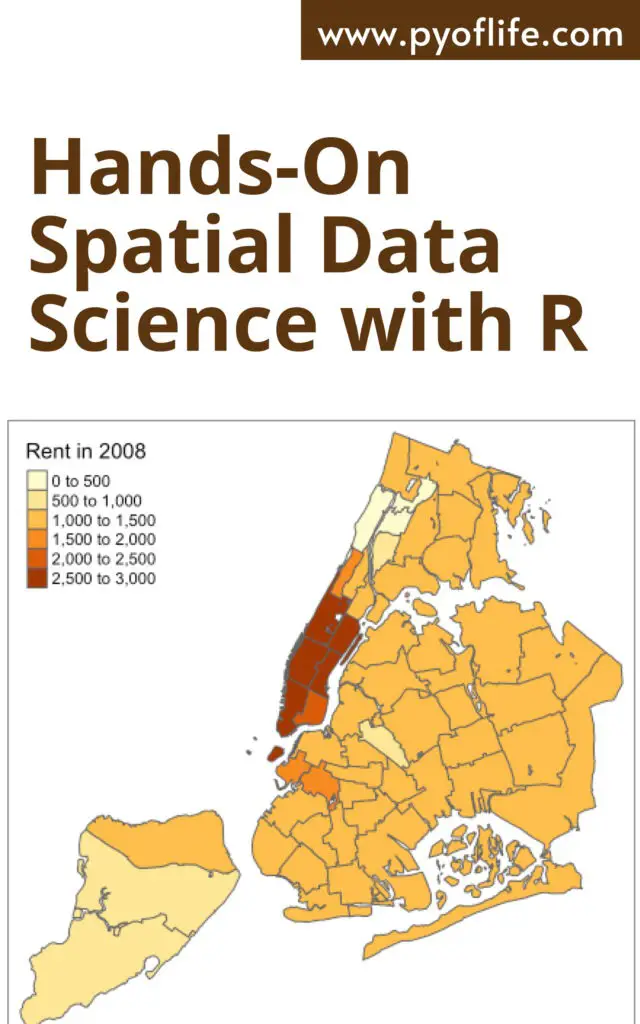
Visualizing the Landscape: Mapping with R
In the realm of spatial data science, visualization is king. R offers a suite of powerful tools for creating stunning maps and visualizations that bring our data to life. From simple scatter plots to intricate choropleth maps, R empowers us to explore and communicate the spatial patterns and relationships inherent in our data.
From Pixels to Patterns: Analyzing Spatial Data with R
Beyond mere visualization, R enables us to conduct sophisticated analyses of spatial data. Through techniques such as spatial autocorrelation, hot spot analysis, and spatial regression, we can uncover the underlying patterns and processes driving spatial phenomena. With R as our compass, we navigate the intricate web of spatial relationships that shape our world.
The Power of Prediction: Spatial Modeling with R
In the realm of spatial data science, prediction is paramount. Whether forecasting urban growth, predicting disease outbreaks, or modeling environmental processes, R equips us with the tools we need to develop accurate and insightful spatial models. Through techniques such as spatial interpolation, machine learning, and geostatistics, we harness the power of R to anticipate future trends and phenomena.
Bridging the Gap: Integrating Spatial Data with Other Tools
In today’s data-driven world, spatial data rarely exists in isolation. Integrating spatial data with other sources of information is essential for unlocking its full potential. Fortunately, R plays well with others, seamlessly integrating with databases, web services, and other analytical tools. Whether accessing data from remote APIs or integrating spatial analysis into a larger workflow, R empowers us to bridge the gap between spatial and non-spatial data sources.
The Art of Exploration: Case Studies in Spatial Data Science with R
To truly appreciate the power of spatial data science with R, we turn to real-world examples. From tracking the spread of infectious diseases to optimizing urban transportation networks, the applications of spatial data science are as diverse as the landscapes they seek to understand. Through a series of captivating case studies, we explore how R enables us to tackle complex spatial problems and unlock actionable insights.
Navigating the Terrain: Challenges and Opportunities in Spatial Data Science
While the potential of spatial data science with R is vast, it is not without its challenges. From data quality issues to computational limitations, navigating the terrain of spatial analysis can be fraught with obstacles. However, with perseverance and ingenuity, these challenges can be overcome, opening up new vistas of opportunity for spatial data scientists everywhere.
Charting the Course: The Future of Spatial Data Science with R
As we chart a course into the future of spatial data science, the role of R remains as vital as ever. With ongoing advancements in technology and methodology, the possibilities for spatial analysis are limitless. Whether pushing the boundaries of machine learning, harnessing the power of big data, or exploring the frontiers of spatial visualization, R will continue to serve as our guiding star in the ever-expanding universe of spatial data science.
Conclusion: Navigating the Digital Frontier with R
In conclusion, spatial data science with R offers a tantalizing glimpse into the hidden landscapes of our world. Through a unique blend of art and science, R empowers us to explore, analyze, and visualize spatial data in ways previously thought impossible. As we journey into this brave new world of spatial discovery, let us embrace the power of R as our faithful companion and guide.
Get Started: Embark on Your Spatial Data Science Journey Today
Ready to unlock the secrets of spatial data science with R? Whether you’re a seasoned analyst or a curious newcomer, there’s never been a better time to dive in. With its intuitive syntax, a vast ecosystem of packages, and a vibrant community of users, R offers endless possibilities for exploration and discovery. So don your digital cartographer’s hat and embark on your spatial data science journey today. The world is waiting to be explored.
Read More: Spatial Statistics for Data Science: Theory and Practice with R
