Learn the Central Limit Theorem in R: The Central Limit Theorem (CLT) is a fundamental concept in statistics that states that if you have a large sample size from any population with a finite mean and variance, then the sampling distribution of the mean will be approximately normal regardless of the shape of the original population distribution. In this tutorial, I will walk you through how to simulate the CLT using R step by step.
Download:
Step 1: Load Required Libraries We will be using the libraries “ggplot2” and “gridExtra” for this tutorial. So, we need to install and load them using the following code:
install.packages("ggplot2")
install.packages("gridExtra")

library(ggplot2)
library(gridExtra)
Step 2: Generate Data Let’s generate some data for this example. We will use the exponential distribution as our population distribution. The exponential distribution is a continuous probability distribution that describes the time between events in a Poisson process. It has a single parameter, which is the rate parameter.
set.seed(123) # for reproducibility
population <- rexp(1000, rate = 1)
Here, we generated 1000 observations from an exponential distribution with a rate parameter of 1.
Step 3: Simulate Sampling Distribution of Means To simulate the CLT, we will take random samples of size n from the population and calculate the mean. We will repeat this process 1000 times and store the means in a vector.
n <- 10 # sample size
num.simulations <- 1000 # number of simulations

sample.means <- replicate(num.simulations, mean(sample(population, n)))
Here, we took random samples of size 10 from the population and calculated the mean. We repeated this process 1000 times and stored the means in the vector “sample.means”.
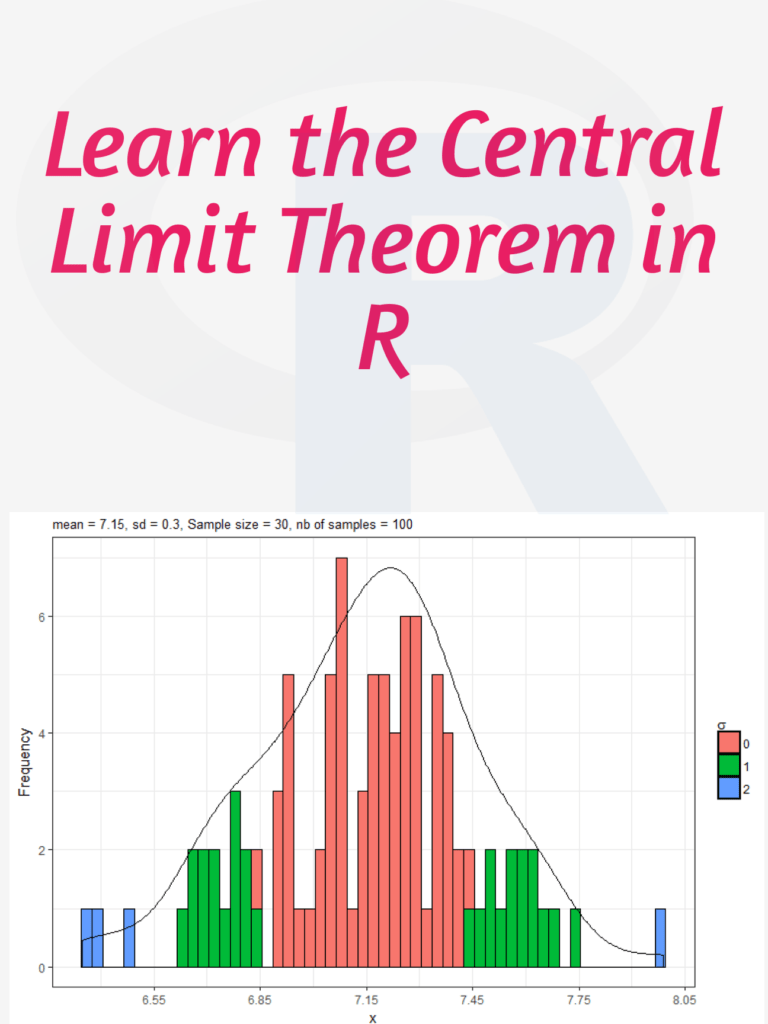
Step 4: Visualize Sampling Distribution of Means Now, we can visualize the sampling distribution of means using a histogram.
# histogram of sample means
ggplot(data.frame(sample.means), aes(x = sample.means)) +
  geom_histogram(aes(y = ..density..), color = "black", fill = "white", binwidth = 0.2) +
  stat_function(fun = dnorm, args = list(mean = mean(population), sd = sd(population)/sqrt(n)), color = "red", size = 1) +
  ggtitle(paste("Sampling Distribution of Means (n = ", n, ")", sep = "")) +
  xlab("Sample Means") +
  ylab("Density")
In this code, we created a histogram of the sample means and added a red line for the theoretical normal distribution with the same mean and standard deviation as the sampling distribution of means. We also added a title and axis labels to the plot.
Step 5: Repeat with Different Sample Sizes Finally, we can repeat this process for different sample sizes and visualize the results using a grid of plots.
# function to simulate CLT and create plot
plot_CLT <- function(n) {
  sample.means <- replicate(num.simulations, mean(sample(population, n)))

  plot <- ggplot(data.frame(sample.means), aes(x = sample.means)) +
    geom_histogram(aes(y = ..density..), color = "black", fill = "white", binwidth = 0.2) +
    stat_function(fun = dnorm, args = list(mean = mean(population), sd = sd(population)/sqrt(n)), color = "red", size = 1) +
    ggtitle(p