Books

Learn R for Applied Statistics: With Data Visualizations, Regressions, and Statistics

Learn R for Applied Statistics: With Data Visualizations, Regressions, and Statistics: Learning R for applied statistics can be a great way to gain insights into data analysis and modeling. It provides a wide range of statistical techniques, including linear and nonlinear modeling, time-series analysis, and multivariate analysis. R is also popular among researchers for data visualization and exploratory data analysis. With its open-source nature and active community, R offers extensive documentation and various packages, making it a powerful tool for statistical analysis and modeling in fields such as economics, biology, social sciences, and more. Its flexibility and ease of use make it an excellent choice for researchers and data analysts of all levels.

R provides several libraries and packages for regression analysis, making it an excellent tool for applied statistics. With its active community and extensive documentation, R is an excellent choice for researchers, data analysts, and scientists of all levels. One of the most widely used libraries for regression analysis in R is the “lm” function. It is used for linear regression and helps users to fit a linear model to a given set of data. The package provides users with several diagnostic measures such as the R-squared value, residual plots, and coefficients. Another popular library for regression analysis in R is the “glm” function.

Learn R for Applied Statistics: With Data Visualizations, Regressions, and Statistics

Download:

The package helps users to fit generalized linear models to a given set of data. The package provides a wide range of regression models such as logistic regression, Poisson regression, and negative binomial regression. The “car” library is another popular package for regression analysis in R. It provides several diagnostic tools and regression models such as ANOVA, MANOVA, and multiple regression. Finally, the “caret” package provides various machine learning algorithms, including regression analysis. The package helps users to train, test, and evaluate regression models and provides several techniques to handle missing data and outliers.

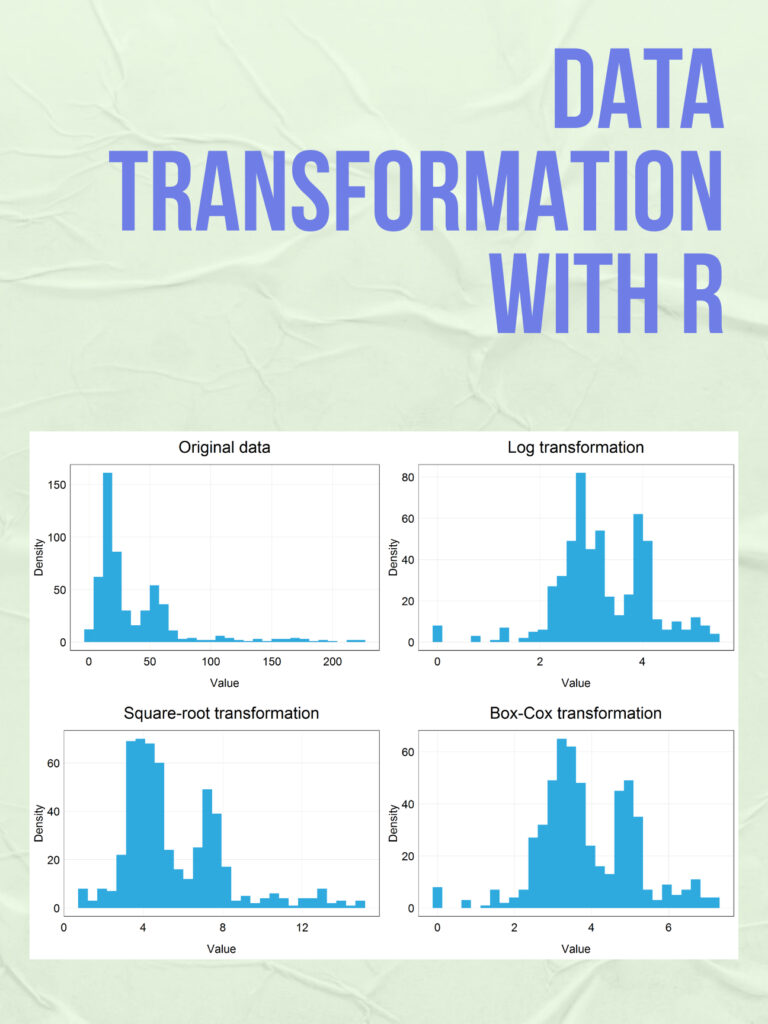
R is an excellent tool for data visualization and exploratory data analysis, offering various packages and libraries for creating high-quality graphics. With its powerful graphics capabilities and active community, R is an excellent choice for researchers, data analysts, and scientists of all levels. R’s ggplot2 package is one of the most widely used libraries for creating data visualizations. It provides a flexible and elegant system for creating complex and informative graphics. Its grammar of graphics approach allows users to create a wide range of visualizations using a consistent set of rules.

Other popular R packages for data visualization include plotly, lattice, and ggvis. Plotly provides interactive visualizations that allow users to explore data in real time, while lattice offers a powerful and flexible system for creating multi-panel plots. ggvis, on the other hand, provides an interactive grammar of graphics system for creating complex visualizations with interactivity.

Download(PDF)

Geographic Data Science with R

Geographic Data Science with R is a powerful tool for analyzing and visualizing spatial data. It allows you to combine statistical analysis with geographic information, allowing you to better understand the patterns and relationships in your data. One of the key benefits of Geographic Data Science with R is its ability to handle large and complex data sets. With R’s powerful tools for data manipulation and visualization, you can quickly explore and analyze large data sets without sacrificing accuracy or speed. Another advantage of Geographic Data Science with R is the ability to work with a wide range of data formats, including raster and vector data. This flexibility makes it easier to work with data from a variety of sources and to integrate different types of data into your analysis. Visualizing and analyzing environmental change is an important application of Geographic Data Science with R. Here are some steps you can follow to get started:

Geographic Data Science with R

Acquire data: Start by collecting environmental data relevant to your study, such as temperature, precipitation, land cover, or vegetation indices. Many sources provide this type of data for free or for a fee, such as NASA, NOAA, or USGS.

Pre-process the data: Once you have obtained the data, you may need to pre-process it to prepare it for analysis. This may include converting data formats, aggregating or disaggregating data to match the scale of your analysis, or removing missing values.

Visualize the data: Use R’s powerful visualization tools to create maps, charts, and other visualizations of the data. For example, you can create heat maps to visualize temperature patterns or time series plots to track changes over time. Interactive maps can also be created using tools such as Leaflet or Shiny.

Analyze the data: Use statistical tools in R to analyze the data and identify patterns or trends. For example, you can use regression analysis to identify relationships between environmental variables, or cluster analysis to identify groups of locations with similar environmental conditions.

Interpret and communicate the results: Once you have analyzed the data, interpret the results and communicate them effectively to stakeholders, policymakers, or the public. Use visualizations and summaries to effectively communicate your findings.

Download:

Data Analysis and Visualization Using Python

Python is a popular programming language for data analysis and visualization due to its versatility and a large number of libraries specifically designed for these tasks. Here are the basic steps to perform data analysis and visualization using Python:

Data Analysis and Visualization Using Python
  1. Import the required libraries: The most commonly used libraries for data analysis and visualization in Python are Pandas, Matplotlib, and Seaborn. You can import them using the following code:
import pandas as pd
import matplotlib.pyplot as plt
import seaborn as sns
  1. Load the data: Once the libraries are imported, you can load the data into a Pandas DataFrame. Pandas provides several functions to read data from different sources, such as CSV files, Excel files, SQL databases, etc. For example, to read a CSV file named ‘data.csv’, you can use the following code:
data = pd.read_csv('data.csv')
  1. Explore the data: Before visualizing the data, it is important to explore it to understand its structure and characteristics. You can use Pandas functions like head(), tail(), describe(), info(), etc. to get a summary of the data.
print(data.head())
print(data.describe())
print(data.info())
  1. Clean the data: If the data contains missing or inconsistent values, you need to clean it before visualizing it. Pandas provides functions to handle missing values and outliers, such as dropna(), fillna(), replace(), etc.
data.dropna(inplace=True) # remove rows with missing values
data.replace({'gender': {'M': 'Male', 'F': 'Female'}}, inplace=True) # replace inconsistent values
  1. Visualize the data: Once the data is cleaned and prepared, you can start visualizing it using Matplotlib and Seaborn. Matplotlib provides basic visualization functions like plot(), scatter(), hist(), etc., while Seaborn provides more advanced functions for statistical data visualization, such as distplot(), boxplot(), heatmap(), etc. Here’s an example of creating a histogram of age distribution using Seaborn:
sns.distplot(data['age'], bins=10)
plt.title('Age Distribution')
plt.xlabel('Age')
plt.ylabel('Density')
plt.show()

These are the basic steps of course, there are many more advanced techniques and libraries available, depending on your specific needs and goals.

Download(PDF)

Data Structures and Algorithms with Python

Data structures and algorithms are fundamental concepts in computer science and software engineering. They help us solve problems more efficiently by organizing and manipulating data in a way that allows for faster retrieval and processing. Python is a popular programming language that is widely used for data analysis, scientific computing, web development, and many other applications. It provides a rich set of built-in data structures and libraries that make it easy to implement common algorithms and data structures.

Data Structures and Algorithms with Python

Some of the commonly used data structures in Python include lists, tuples, sets, and dictionaries. Lists are mutable sequences of elements, tuples are immutable sequences, sets are unordered collections of unique elements, and dictionaries are mappings between keys and values.

There are also several libraries in Python that provide more advanced data structures and algorithms, such as NumPy, Pandas, and Scikit-learn for data analysis and machine learning, and NetworkX for graph algorithms.

When it comes to algorithms, Python provides a rich set of built-in functions and libraries that make it easy to implement common algorithms, such as sorting, searching, and graph traversal. Some of the popular algorithms that are commonly implemented in Python include binary search, quicksort, mergesort, and breadth-first search.

To master data structures and algorithms with Python, it is important to have a good understanding of the fundamental concepts, as well as the specific features and libraries provided by the language. It is also helpful to practice implementing algorithms and data structures in Python and to study examples and tutorials from experienced programmers and online resources.

Download(PDF)

Statistics and Data Analysis for Financial Engineering

Statistics and data analysis are essential skills for financial engineering, as they provide the foundation for modeling and analyzing financial data. R is a popular programming language for data analysis and statistical modeling, and it has numerous packages that are well-suited for financial engineering applications. Here are some key areas where statistics and data analysis can be applied in financial engineering using R:

Statistics and Data Analysis for Financial Engineering

Risk Analysis: Financial engineers use statistical methods to estimate the likelihood of different types of risks, such as market risk, credit risk, and operational risk. R has several packages like “Risk” and “fBasics” that can be used to perform different types of risk analysis.

Time Series Analysis: Financial time series data typically exhibit patterns such as trends, seasonality, and autocorrelation. R has several packages like “tseries” and “forecast” that are specifically designed for analyzing time series data.

Portfolio Optimization: Financial engineers use statistical methods to optimize investment portfolios by balancing risk and return. R has several packages like “PortfolioAnalytics” and “quantmod” that can be used to perform portfolio optimization.

Monte Carlo Simulation: Monte Carlo simulation is a powerful statistical technique used to model complex systems and estimate probabilities. In finance, Monte Carlo simulation is used to estimate the value of financial derivatives and to simulate the behavior of financial markets. R has several packages like “mc2d” and “MCMCpack” that can be used for Monte Carlo simulation.

Data Visualization: Data visualization is an important part of data analysis in financial engineering. R has several packages like “ggplot2” and “lattice” that can be used to create visualizations of financial data.

Download(PDF)

Data transformation with R

Data transformation is a crucial step in data analysis, and R provides many powerful tools for transforming and manipulating data. Here is an example of data transformation using R: Suppose you have a dataset called “mydata” that contains information about some customers, including their name, age, gender, and income. Here is a sample of what the data might look like:

Data transformation with R
   name  age gender income
1   Bob   25      M  50000
2 Alice   30      F  60000
3   Tom   35      M  70000
4   Sue   40      F  80000

Now, let’s say you want to perform some data transformation on this dataset. Here are some common data transformations that you can do with R:

  1. Subset the data:

You can select a subset of the data based on some criteria using the subset() function. For example, you can select only the customers who are over 30 years old:

mydata_subset <- subset(mydata, age > 30)

This will create a new dataset called “mydata_subset” that contains only the rows where age is greater than 30.

  1. Rename columns:

You can rename the columns in the dataset using the colnames() function. For example, you can rename the “gender” column to “sex”:

colnames(mydata)[3] <- "sex"

This will rename the third column (which is the “gender” column) to “sex”.

  1. Reorder columns:

You can reorder the columns in the dataset using the select() function from the dplyr package. For example, you can move the “income” column to the front of the dataset:

library(dplyr)
mydata_new <- select(mydata, income, everything())

This will create a new dataset called “mydata_new” that has the “income” column as the first column, followed by the other columns in the original dataset.

  1. Create new columns:

You can create new columns in the dataset based on some calculation or function using the mutate() function from the dplyr package. For example, you can create a new column called “income_log” that contains the logarithm of the “income” column:

mydata_new <- mutate(mydata, income_log = log(income))

This will create a new dataset called “mydata_new” that has a new column called “income_log” containing the logarithm of the “income” column.

  1. Group and summarize data:

You can group the data based on some variable and summarize the data using the group_by() and summarize() functions from the dplyr package. For example, you can group the data by “sex” and calculate the average income for each sex:

mydata_summary <- mydata %>%
  group_by(sex) %>%
  summarize(avg_income = mean(income))

This will create a new dataset called “mydata_summary” that has two rows (one for each sex) and one column called “avg_income” containing the average income for each sex.

Download(PDF)

Statistical Learning with Math and R

Statistical Learning with Math and R: Statistical learning is an essential tool for data analysis and machine learning. It involves using mathematical methods and programming languages like R to analyze and model data. In this article, we will discuss statistical learning and its applications in data science.

Statistical Learning with Math and R

What is statistical learning?

Statistical learning is a field of study that focuses on building models to make predictions or decisions based on data. It involves using statistical and mathematical techniques to extract insights from data. Statistical learning models can be used to understand relationships between variables, predict outcomes, and make decisions.

The goal of statistical learning is to find patterns and relationships within data that can be used to make predictions. It can be supervised or unsupervised. The model is trained using labeled data in supervised learning, where the outcome variable is known. In unsupervised learning, the model is trained using unlabeled data, and the goal is to discover hidden patterns or structures within the data.

Mathematics in Statistical learning

Mathematics is a fundamental aspect of statistical learning. It provides the necessary tools to model and analyze data. Linear algebra, calculus, probability theory, and optimization are all essential mathematical concepts used in statistical learning.

Linear algebra is used to represent data in a structured way, such as vectors and matrices. It is also used to solve systems of equations and perform operations such as matrix multiplication and matrix inversion.

Calculus is used to optimize models and find the best parameters that fit the data. It is used to find the maximum or minimum of a function, which can be used to optimize model parameters.

Probability theory is used to understand the uncertainty in data and make predictions based on probabilities. It is used to model random variables and distributions, essential for building statistical models.

Optimization is used to find the best parameters for a model that fit the data. It involves finding the minimum or maximum of a function, which can be done using calculus.

R in Statistical learning

R is a programming language and environment that is widely used for statistical computing and graphics. It provides a range of tools and packages for data analysis, visualization, and modeling. R is an open-source language, which means that it is free to use, and it has a large community of users who contribute to its development.

R provides a range of packages for statistical learning, such as caret, glmnet, randomForest, and xgboost. These packages provide tools for building and evaluating models, as well as tools for preprocessing data and performing feature selection.

R also provides a range of visualization tools, such as ggplot2, which can be used to visualize data and model outputs. Visualization is an essential aspect of statistical learning because it helps to understand the relationships between variables and the performance of models.

Download(PDF)

Math And Python Statistical Learning

Statistical learning is a branch of statistics that deals with modeling and analyzing data using various mathematical and computational tools. It involves understanding the underlying patterns and relationships within the data and using them to make predictions and informed decisions. Python is a popular programming language used for statistical learning, as it offers a wide range of powerful libraries and tools for data analysis, visualization, and machine learning.

Math And Python Statistical Learning

To get started with statistical learning using math and Python, here are some key concepts and tools to consider:

  1. Probability and statistics: A solid foundation in probability theory and statistics is essential for statistical learning. This includes understanding concepts such as probability distributions, hypothesis testing, regression analysis, and Bayesian inference.
  2. Linear algebra: Linear algebra is a fundamental mathematical concept that underpins many statistical learning algorithms. Understanding concepts such as vectors, matrices, and eigenvectors can help with tasks such as data preprocessing, dimensionality reduction, and optimization.
  3. Python libraries: Python has a wealth of libraries and tools for statistical learning, including NumPy for numerical computing, pandas for data manipulation, matplotlib and seaborn for data visualization, and scikit-learn for machine learning algorithms.
  4. Data preprocessing: Before applying statistical learning algorithms, data must be preprocessed and cleaned. This includes tasks such as removing missing values, scaling features, and handling categorical variables.
  5. Machine learning algorithms: There are many machine learning algorithms that can be used for statistical learning, including linear regression, logistic regression, decision trees, random forests, support vector machines, and neural networks. Each algorithm has its strengths and weaknesses, and choosing the right one depends on the specific task and data at hand.

Overall, statistical learning with math and Python requires a combination of mathematical knowledge, programming skills, and domain expertise. With the right tools and understanding, you can use statistical learning to gain insights from data and make more informed decisions.

Download(PDF)

Introduction To R For Excel

R is a popular open-source programming language that is widely used for statistical computing, data analysis, and data visualization. It offers a wide range of tools and libraries for working with data and has become increasingly popular among data scientists and statisticians. If you are an Excel user who is interested in learning R, you might be wondering how to get started. In this article, we will provide an introduction to R for Excel users, including the benefits of using R, the differences between R and Excel, and tips for transitioning to R.

Introduction To R For Excel

Benefits of using R

R offers several advantages over Excel, including:

  1. Large data handling: R is designed to handle large datasets with ease. It is capable of handling datasets that are too large to fit in Excel, and can handle more complex data structures.
  2. Powerful statistics: R has a vast range of statistical analysis capabilities built-in. R provides a powerful set of statistical and graphical techniques, including linear and nonlinear modelling, time-series analysis, classification, clustering, and more.
  3. Open-source community: R is an open-source language, which means it is continuously developed by an active community of users. This community provides a wealth of resources and support, including libraries, packages, and forums.
  4. Reproducible research: R makes it easy to create reproducible research by documenting every step of your analysis. This ensures that your results are transparent and easily replicable.

Differences between R and Excel

While Excel is a powerful tool for working with data, it has its limitations. Excel is designed for small to medium-sized datasets and is not well-suited to handling complex data structures. Here are some key differences between R and Excel:

  1. Data Structures: In Excel, data is usually stored in tables with columns and rows. R has many more data structures, such as vectors, matrices, arrays, and data frames. Each data structure can handle different types of data and operations.
  2. Functions: In Excel, functions are pre-built formulas that perform specific tasks on data. In R, functions are built into the language and can be easily extended using packages. R provides a wide range of built-in functions and packages for statistical analysis and data manipulation.
  3. Programming: R is a programming language, while Excel is a spreadsheet program. This means that R requires you to write code to perform tasks, while Excel requires you to manually enter data and use pre-built functions.

Tips for transitioning to R

If you are an Excel user who is interested in learning R, here are some tips to help you get started:

  1. Learn the basics: Start by learning the basics of R, including data structures, functions, and programming concepts. There are many online resources available, including tutorials and videos.
  2. Start with small datasets: Start by working with small datasets to get comfortable with R. As you gain more experience, you can move on to larger and more complex datasets.
  3. Use RStudio: RStudio is a popular integrated development environment (IDE) for R. It provides an easy-to-use interface for writing and running code, as well as tools for data visualization and exploration.
  4. Use packages: R has a vast range of packages that can be used to extend its functionality. Start by learning the most commonly used packages for data manipulation and statistical analysis, such as dplyr and ggplot2.
  5. Practice: Practice is key to becoming proficient in R. Try working on small projects, participating in online communities, and contributing to open-source projects to improve your skills.

Download:

Python for probability statistics and machine learning

Python is a popular programming language that has gained significant traction in the fields of probability, statistics, and machine learning. With its user-friendly syntax and extensive libraries, Python has become the go-to language for data analysis and modeling. In this article, we will explore the various Python libraries that make it an ideal choice for probability, statistics, and machine learning.

Python for probability statistics and machine learning

Python for probability statistics and machine learning                      Download:

NumPy

NumPy is a library for Python that provides support for large, multi-dimensional arrays and matrices, as well as a variety of mathematical functions. It is a fundamental library for scientific computing in Python and is widely used in the fields of probability and statistics. NumPy is particularly useful for generating random numbers and for working with probability distributions.

Pandas

Pandas is a library for Python that provides support for data manipulation and analysis. It provides a variety of tools for working with structured data, including dataframes and series, which make it easy to work with datasets of different sizes and shapes. Pandas is particularly useful for data preprocessing and cleaning, which is an essential step in any data analysis or modeling project.

Matplotlib

Matplotlib is a library for Python that provides support for data visualization. It provides a variety of tools for creating plots, charts, and graphs, which make it easy to visualize data and explore patterns and relationships. Matplotlib is particularly useful for exploring data and communicating results to others.

Scikit-learn

Scikit-learn is a library for Python that provides support for machine learning. It provides a variety of tools for building predictive models, including classification, regression, and clustering algorithms. Scikit-learn is particularly useful for building predictive models and for evaluating the performance of those models.

Statsmodels

Statsmodels is a library for Python that provides support for statistical modeling. It provides a variety of tools for fitting statistical models, including linear regression, time series analysis, and multivariate analysis. Statsmodels is particularly useful for building statistical models and for testing hypotheses.

PyMC3

PyMC3 is a library for Python that provides support for Bayesian modeling. It provides various tools for building Bayesian models, including Markov Chain Monte Carlo (MCMC) algorithms for sampling from posterior distributions. PyMC3 is particularly useful for building Bayesian models and for quantifying uncertainty.

Download(PDF)