The Essentials of Data Science: Knowledge Discovery Using R: R is a powerful tool for data science that allows you to perform data preparation, data exploration and visualization, statistical analysis, machine learning, and communication all within the same environment. With its extensive libraries and active community, R is an essential tool for any data scientist. In this article, we will discuss the essentials of data science using R.
- Data Preparation The first step in any data science project is data preparation. This involves cleaning and transforming raw data into a form that can be analyzed. Common data preparation tasks include data cleaning, data transformation, and data integration. R has many built-in functions and packages for data preparation, including dplyr, tidyr, and lubridate.
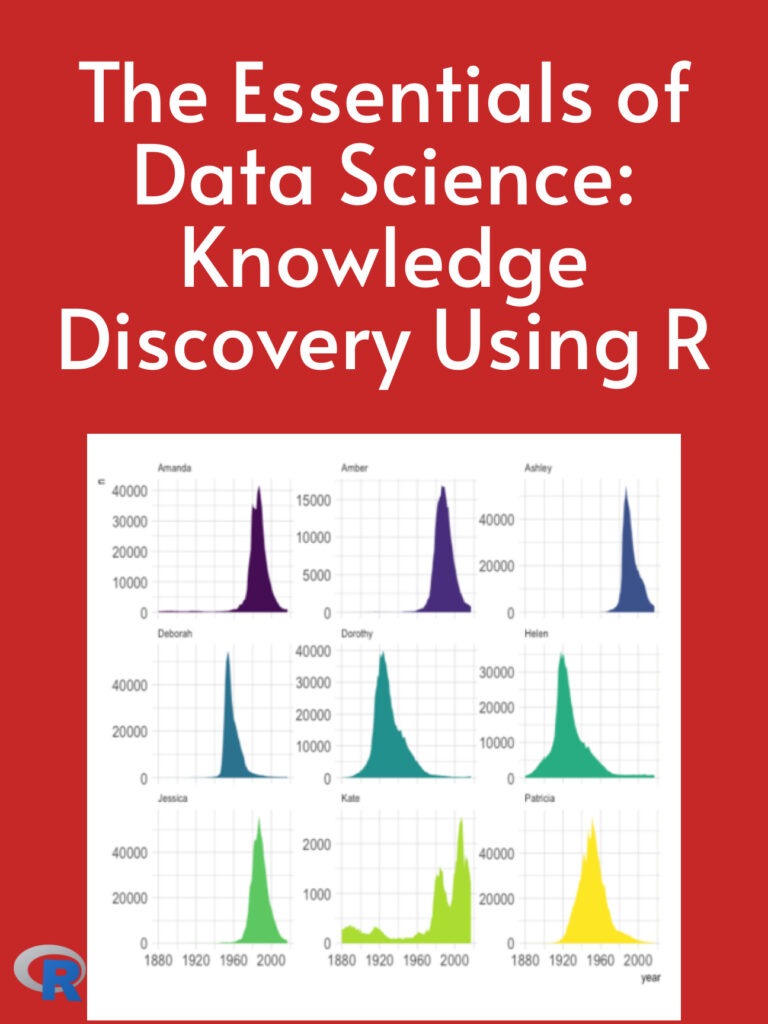
- Data Exploration and Visualization Once the data has been prepared, the next step is data exploration and visualization. This involves analyzing the data to gain insights and identify patterns. R has many powerful visualization packages, including ggplot2 and lattice, that allow you to create a wide range of visualizations, such as scatter plots, bar charts, and heat maps.
- Statistical Analysis After data exploration, the next step is statistical analysis. This involves using statistical methods to test hypotheses and make predictions. R has many built-in functions and packages for statistical analysis, including lm() for linear regression and glm() for generalized linear models.
- Machine Learning Machine learning is a subfield of data science that involves using algorithms to learn from data and make predictions. R has many powerful machine learning packages, including caret, mlr, and tensorflow, that allow you to build a wide range of machine learning models, such as linear regression, decision trees, and neural networks.
- Communication The final step in any data science project is communication. This involves communicating your findings and insights to stakeholders in a clear and concise manner. R has many powerful tools for communication, including R Markdown and Shiny, that allow you to create interactive reports and dashboards.
