Geographic Data Science is an emerging field that combines spatial analysis, statistical modeling, and data visualization techniques to explore patterns and relationships within geographic data. With the advent of open-source software and programming languages like Python, it has become easier than ever before to work with large datasets and create dynamic visualizations that reveal complex patterns in geographic data.
Python is a popular programming language for Geographic Data Science due to its versatility, ease of use, and wide range of powerful libraries such as geopandas, matplotlib, and seaborn. These libraries enable users to easily manipulate, visualize and analyze geographic data.
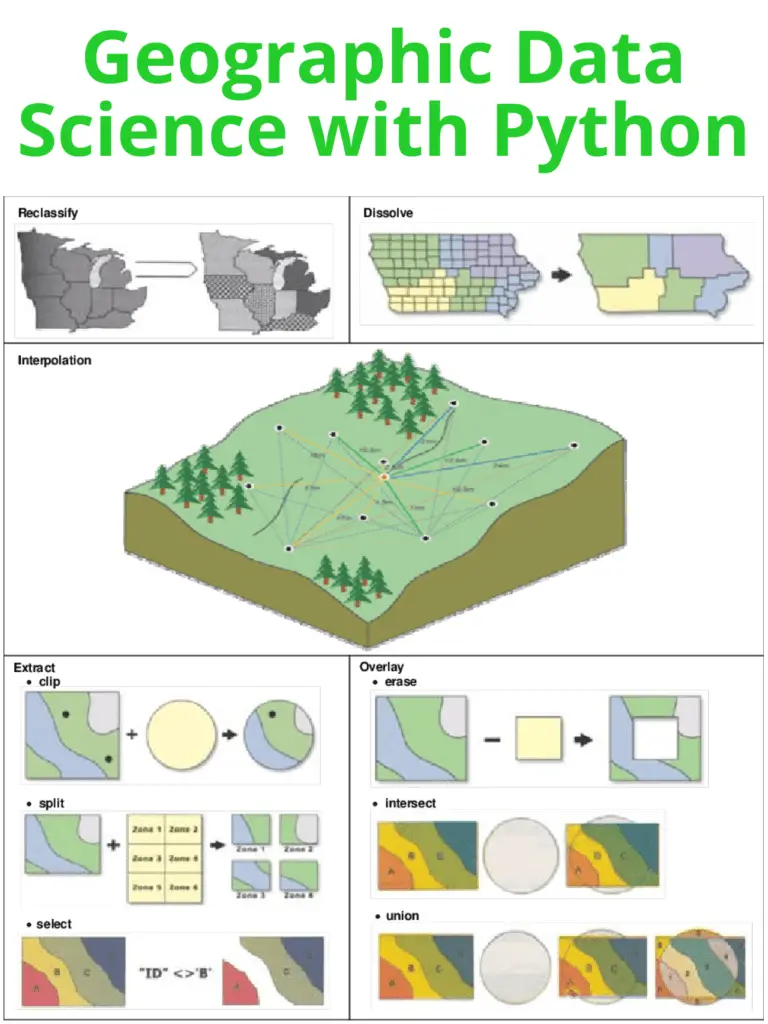
The geopandas library is particularly useful for working with geospatial data as it provides an easy way to read, write, and manipulate geographic data in a variety of formats, such as shapefiles and GeoJSON files. It also allows users to perform spatial operations such as overlaying polygons, buffering points, and calculating distances.
Matplotlib and seaborn are two popular libraries for data visualization in Python. Matplotlib provides a wide range of customizable plots such as scatterplots, histograms, and heatmaps. Seaborn, on the other hand, provides a higher-level interface for creating more complex visualizations such as heatmaps with annotations and faceted plots.
Another important library for Geographic Data Science in Python is scikit-learn. It provides a range of machine learning algorithms that can be applied to geographic data, such as clustering and classification. For instance, clustering algorithms can be used to group similar locations together based on their features, while classification algorithms can be used to predict the land use of a given area based on its features.
With these libraries, Geographic Data Science with Python can be applied to a wide range of applications. For instance, it can be used to analyze environmental data, such as air pollution levels, and identify hotspots where pollution is most severe. It can also be used to analyze demographic data and identify patterns of inequality or segregation within a city.
Learn More: Geographic Data Science with R
