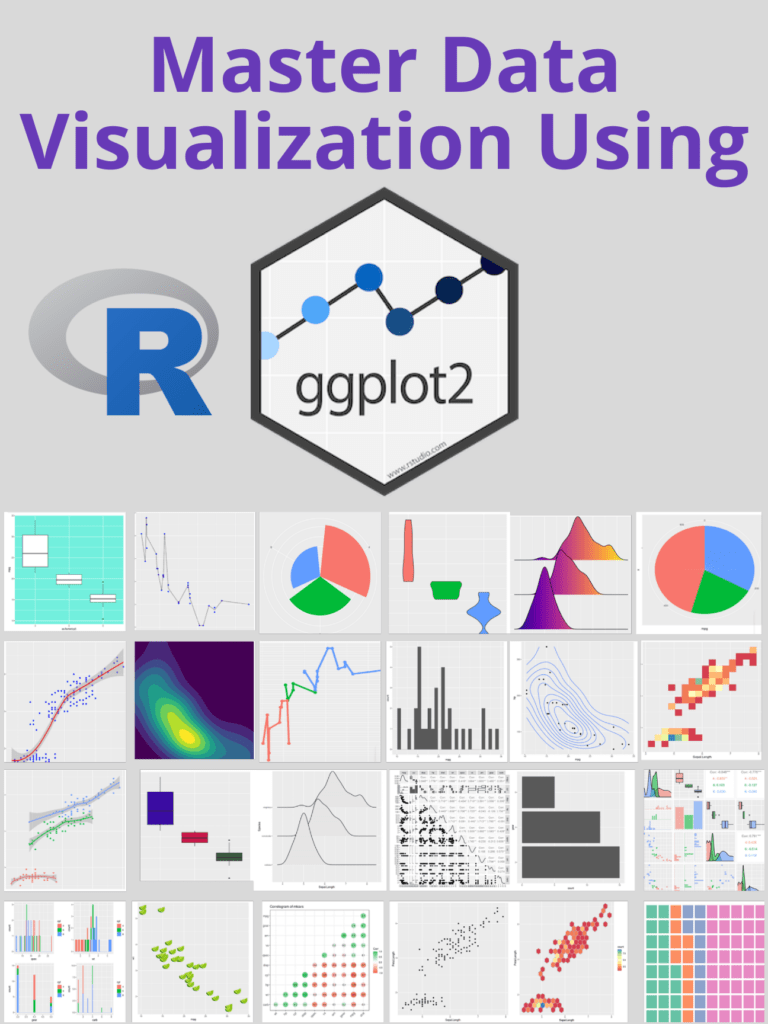
To master data visualization using ggplot2, it is important to start with the basics and understand the different components of a plot, such as layers, aesthetics, and scales. Learning the grammar of graphics, which is the foundation of ggplot2, is essential for creating complex and customized visualizations. Practicing creating different types of visualizations with ggplot2, starting with simple plots and gradually working your way up to more complex ones, can help improve your skills.
Additionally, it’s helpful to learn from others by examining examples of ggplot2 visualizations and utilizing online resources like blogs, forums, and tutorials. Experimenting with different chart types and using color effectively are important aspects of creating visually appealing and informative visualizations. Lastly, it’s important to consider accessibility for all users when creating visualizations, by using appropriate contrast and avoiding colorblindness issues, among other considerations. By following these steps, you can become proficient in data visualization using ggplot2.
Download:
Let’s understand with an example
let’s use the “mtcars” dataset that comes with R. This dataset contains information about various cars, including their miles per gallon (mpg), horsepower (hp), and weight (wt).
First, we need to load the ggplot2 package and the mtcars dataset:
library(ggplot2)
data(mtcars)
Next, let’s create a scatterplot of mpg versus horsepower. We can do this using the ggplot() function, specifying the dataset to use and the aesthetic mappings (i.e., which variables to map to the x and y axes):
ggplot(data = mtcars, aes(x = hp, y = mpg)) +
  geom_point()
This will create a basic scatterplot with horsepower on the x-axis and mpg on the y-axis. We use the geom_point() function to add points to the plot.
Next, let’s add a regression line to the plot to show the relationship between the two variables more clearly:
ggplot(data = mtcars, aes(x = hp, y = mpg)) +
  geom_point() +
  geom_smooth(method = "lm")
We add the geom_smooth() function with the “lm” (linear model) method to add a regression line to the plot.
Finally, let’s customize the plot a bit by changing the color of the points and regression line, adding axis labels and a title, and adjusting the axis limits:
ggplot(data = mtcars, aes(x = hp, y = mpg)) +
  geom_point(color = "blue") +
  geom_smooth(method = "lm", color = "red") +
  labs(x = "Horsepower", y = "Miles per gallon", title = "Relationship between horsepower and miles per gallon") +
  theme_classic() +
  xlim(c(0, 400)) +
  ylim(c(0, 35))
We use the labs() function to add axis labels and a title, and the theme_classic() function to change the plot theme to a more classic style. We also use the xlim() and ylim() functions to adjust the axis limits.
This should give you a good idea of how to create a basic data visualization using ggplot2 in R. Of course, there are many other types of plots and customizations you can make using ggplot2, but this should serve as a starting point.
