Beginning Data Science in R: Data Analysis, Visualization, and Modelling for the Data Scientist

Beginning Data Science in R: Data science is an interdisciplinary field that uses scientific methods, processes, algorithms, and systems to extract knowledge and insights from structured and unstructured data. It involves a combination of statistics, mathematics, computer science, and domain-specific knowledge to understand complex data and solve real-world problems. In this article, we will discuss the basics of data science in R, including data analysis, visualization, and modeling. 

Beginning Data Science in R Data Analysis, Visualization, and Modelling for the Data Scientist

Data Analysis: It involves the process of cleaning, transforming, and exploring data to extract insights and knowledge. In R, we can use a variety of packages for data analysis, including tidyverse, dplyr, and data.table. The tidyverse package provides a suite of packages that help in data cleaning, transformation, and visualization. The dplyr package provides a set of functions for data manipulation, including filtering, selecting, summarizing, and grouping. The data.table package is another popular package for data manipulation, especially for large datasets.

Data visualization: It is a critical component of data analysis and interpretation, and R is a popular tool for creating informative and visually appealing graphs, charts, and plots. R provides a wide range of packages for data visualization, including ggplot2, lattice, and base graphics. ggplot2 is a highly customizable package for creating complex and visually appealing graphics, while lattice provides a range of specialized plots for specific data types, such as the dotplot and barchart. Base graphics provide a basic set of graphics functions for creating standard plots such as histograms, scatterplots, and bar charts. With R’s flexible and powerful data visualization capabilities, analysts can effectively communicate insights and trends in their data to a wide range of audiences.

Data modeling: It is a crucial aspect of data science and analytics, and R is a popular programming language used for data modeling. In R, there are various packages and functions available for data modeling, including those for linear regression, logistic regression, time-series analysis, and machine learning algorithms like decision trees and random forests. Data modeling with R involves preparing the data by cleaning and transforming it, selecting appropriate variables, and choosing the appropriate modeling technique based on the nature of the data and the research question. Once the model is built, it must be evaluated for accuracy and effectiveness, and the results can be visualized and communicated to stakeholders. Overall, data modeling with R can provide valuable insights and predictions for a wide range of industries and applications.

Download (PDF)

Foundational Python for Data Science

In the realm of data science, Python stands tall as the preferred programming language for both beginners and experts. Its simplicity, versatility, and powerful libraries make it an invaluable tool for data analysis, machine learning, and more. In this article, we will delve into the foundational aspects of Python for data science, ensuring you grasp the essentials. Let’s embark on this journey together.

Understanding Foundational Python for Data Science

Python, often referred to as the “Swiss Army knife” of programming languages, is renowned for its readability and user-friendly syntax. This section will cover the fundamental concepts that every aspiring data scientist should master.

Variables and Data Types

Python supports various data types, including integers, floats, strings, and booleans. Understanding how to declare and manipulate variables is crucial. It allows you to store and work with different types of data efficiently.

Foundational Python for Data Science

Control Structures

Learn about essential control structures such as loops and conditional statements. These enable you to control the flow of your programs, making them dynamic and responsive.

Functions and Modules

Functions and modules are Python’s building blocks for code organization and reusability. Discover how to create and use them to simplify your code and make it more maintainable.

Libraries for Data Science

Python’s strength lies in its libraries. Explore libraries like NumPy, Pandas, and Matplotlib, which provide powerful tools for data manipulation, analysis, and visualization.

Working with Data

Data is at the heart of data science. Learn how to import, clean, and preprocess data, preparing it for analysis and modeling.

Basic Statistics

Get acquainted with basic statistical concepts and techniques. These skills are essential for drawing insights from data.

Introduction to Machine Learning

Python’s extensive ML libraries make it a go-to choice for budding data scientists. Get a glimpse of the machine learning landscape and how Python fits into it.

FAQ’s

How do I install Python for data science?

You can download Python from the official website (https://www.python.org/) and install it on your computer. Additionally, you can use Python distributions like Anaconda, which come bundled with essential data science libraries.

What are the advantages of Python for data science?

Python’s advantages include a vast ecosystem of libraries, a supportive community, and ease of learning. It is versatile and suitable for various data science tasks, from data cleaning to machine learning.

Is Python suitable for beginners in data science?

Absolutely! Python’s readability and simplicity make it an excellent choice for beginners. It provides a gentle learning curve while offering powerful capabilities for data science projects.

How can I visualize data in Python?

You can use libraries like Matplotlib and Seaborn to create stunning visualizations. These libraries offer a wide range of customizable plots and charts.

What resources can I use to learn Python for data science?

There are numerous online courses, tutorials, and books available. Websites like Coursera, edX, and Udemy offer comprehensive courses, while platforms like Stack Overflow and GitHub provide a wealth of code examples and discussions.

How do I get started with machine learning in Python?

Start by learning the basics of machine learning algorithms and libraries like Scikit-Learn. Then, work on simple projects to apply your knowledge and gain practical experience.

Conclusion

In this comprehensive guide, we’ve covered the foundational aspects of Python for data science. From variables and data types to machine learning, you now have a solid understanding of the essentials. Remember that practice is key to mastery, so embark on your data science journey with confidence. Happy coding!

Download(PDF)

Download: Mastering Python for Data Science

Data Science and Machine Learning Mathematical and Statistical Methods

In the era of digital transformation, data has become the cornerstone of decision-making across industries. Data Science and Machine Learning are the driving forces behind extracting meaningful insights from data. In this article, we will delve deep into Data Science and Machine Learning Mathematical and Statistical Methods, equipping you with knowledge that can transform the way you harness data for better decision-making.

Understanding the Basics

Data Science and Machine Learning, at their core, rely on mathematical and statistical principles. These techniques are essential for:

  • Data Cleaning: Removing inconsistencies and outliers.
  • Data Transformation: Converting data into suitable formats.
  • Data Analysis: Gaining insights through statistical measures.
  • Predictive Modeling: Building algorithms for forecasting.
Data Science and Machine Learning Mathematical and Statistical Methods

The Role of Linear Algebra

Linear Algebra plays a pivotal role in these methods. It deals with vectors and matrices, making it indispensable for tasks such as:

  • Principal Component Analysis (PCA): Reducing dimensionality.
  • Singular Value Decomposition (SVD): Extracting features.
  • Eigenvalues and Eigenvectors: Identifying patterns.

Probability and Statistics

Probability theory and statistics are the bedrock of Data Science and Machine Learning. They are instrumental in:

  • Hypothesis Testing: Confirming or refuting assumptions.
  • Regression Analysis: Modeling relationships between variables.
  • Bayesian Inference: Updating beliefs based on evidence.

Calculus for Optimization

Calculus enables optimization in Machine Learning. Key applications include:

  • Gradient Descent: Adjusting model parameters.
  • Cost Function Minimization: Improving model performance.
  • Derivatives and Integrals: Calculating rates of change.

Applying Data Science and Machine Learning Mathematical and Statistical Methods

Feature Engineering

Feature engineering involves creating relevant input variables. It enhances model accuracy and includes techniques like:

  • One-Hot Encoding: Handling categorical data.
  • Feature Scaling: Normalizing data for consistency.
  • Feature Selection: Identifying the most influential variables.

Model Building and Evaluation

Building a robust model is crucial. Methods like Cross-Validation and:

  • K-Fold Cross-Validation: Assessing model generalization.
  • Hyperparameter Tuning: Optimizing model performance.
  • Confusion Matrix: Evaluating classification models.

Time Series Analysis

For time-dependent data, time series analysis is vital. Techniques encompass:

  • Autocorrelation Function (ACF): Identifying temporal patterns.
  • Moving Averages: Smoothing data for trends.
  • Exponential Smoothing: Forecasting future values.

Anomaly Detection

Identifying anomalies is critical in various domains. Methods include:

  • Z-Score: Detecting outliers through standard deviation.
  • Isolation Forest: Isolating anomalies in high-dimensional data.
  • Clustering-Based Methods: Grouping anomalies together.

Conclusion

In conclusion, Data Science and Machine Learning Mathematical and Statistical Methods are the backbone of data-driven decision-making. Understanding these techniques empowers individuals and organizations to extract valuable insights from data, driving innovation and success. So, dive into the world of data with confidence, armed with the knowledge of these fundamental methods.

Download(PDF)

Download: Foundations of Machine Learning

Spatial Statistics for Data Science: Theory and Practice with R

Spatial Statistics for Data Science: Theory and Practice with R: Spatial statistics is the branch of statistics that deals with data distributed in space or across geographic locations. This field is instrumental in solving complex problems where location matters, such as urban planning, environmental monitoring, and epidemiology. Spatial data often exhibits patterns that standard statistical methods can’t handle, making spatial statistics an essential tool for data scientists.

Why do spatial statistics matter in data science? Consider a scenario where you’re analyzing retail sales data. Traditional statistics can tell you about overall sales trends, but spatial statistics can reveal spatial patterns. Are there certain areas with consistently high sales? Are there clusters of underperforming stores that need attention? Spatial statistics can answer these questions and guide data-driven decision-making.

Spatial Statistics for Data Science Theory and Practice with R

Key Concepts in Spatial Statistics

Spatial Autocorrelation

Spatial autocorrelation is the foundation of spatial statistics. It examines the extent to which nearby locations are similar in terms of the variables being studied. In other words, it helps us understand if values in one location are influenced by values in neighboring locations. This concept is crucial for detecting spatial patterns and dependencies.

Spatial Interpolation

Spatial interpolation involves estimating values at unsampled locations based on the values at sampled locations. It’s like connecting the dots on a map to create a complete picture. Spatial interpolation methods, such as kriging and inverse distance weighting, are commonly used in geostatistics.

Point Pattern Analysis

Point pattern analysis focuses on the distribution of points in space. It’s often used in studies of phenomena like crime incidents, disease outbreaks, or wildlife sightings. Analyzing point patterns can reveal clustering or dispersion, helping us understand underlying processes.

Geostatistics

Geostatistics is a specialized field within spatial statistics that deals with the variability of spatial data. It employs techniques like variograms and covariograms to model and predict spatial phenomena accurately. Geostatistical methods are especially useful in natural resource management and environmental modeling.

Tools for Spatial Analysis in R

Now that we’ve introduced spatial statistics and its key concepts, let’s explore how R can be a valuable tool for spatial data analysis.

Introduction to R and its Capabilities

R is a versatile programming language for statistical computing and graphics. It provides a rich ecosystem of packages for various data analysis tasks, including spatial analysis. Its extensive community support and active development sets R apart, making it a top choice for data scientists worldwide.

Installing and Loading Spatial Packages

To work with spatial data in R, you’ll need to install and load specific packages. Popular packages like sf, spatial, and raster extend R’s capabilities to handle spatial datasets, perform geospatial operations, and create maps.

Importing and Preprocessing Spatial Data

Before diving into analysis, it’s essential to import and preprocess your spatial data properly. R offers functions to read various spatial data formats, such as shapefiles, GeoJSON, and spatial databases. Data preprocessing includes tasks like data cleaning, coordinate transformation, and handling missing values.

Spatial Visualization in R

Effective visualization is a key aspect of spatial data analysis. R provides numerous tools for creating compelling maps and visualizations.

Creating Static Maps

With R, you can create static maps using packages like ggplot2 and tmap. These libraries allow you to customize map aesthetics and display spatial patterns effectively.

Interactive Mapping with Shiny

R’s Shiny framework enables the creation of interactive web applications for spatial data visualization. It’s a powerful way to engage stakeholders and explore data collaboratively.

Visualizing Spatial Patterns

Visualizing spatial patterns helps reveal trends and anomalies. R provides tools for heatmap creation, choropleth maps, and spatial clustering visualizations.

Spatial Data Exploration

Once your data is prepared and visualized, it’s time for exploratory data analysis (EDA) in the spatial context.

Exploratory Data Analysis (EDA)

EDA involves descriptive statistics, data distribution analysis, and identifying outliers or spatial clusters. It provides valuable insights into the characteristics of your spatial data.

Detecting Spatial Outliers

Spatial outliers are data points that deviate significantly from their neighboring points. Detecting these outliers is crucial for data quality assessment.

Analyzing Spatial Trends

EDA also helps uncover spatial trends, such as the presence of hotspots (areas with high values) or cold spots (areas with low values). Understanding these trends informs further analysis and decision-making.

Spatial Regression Analysis

Spatial regression is a powerful technique for modeling relationships between variables while accounting for spatial dependencies.

Introduction to Spatial Regression

In traditional regression analysis, it’s assumed that data points are independent. However, in spatial regression, we acknowledge that neighboring data points can influence each other. This is especially relevant when studying phenomena with spatial patterns, like housing prices or air pollution.

Ordinary Least Squares (OLS) vs. Spatial Regression

We’ll explore the differences between ordinary least squares (OLS) regression and spatial regression. OLS may produce biased results when spatial autocorrelation is present, while spatial regression models account for this autocorrelation.

Model Interpretation and Diagnostics

Interpreting spatial regression models and assessing their performance are essential steps in spatial data analysis. We’ll discuss techniques for model interpretation and diagnostics.

Spatial Clustering

Unsupervised learning techniques can identify spatial clusters in your data.

Unsupervised Learning in Spatial Data

Spatial clustering methods like DBSCAN and K-means can uncover hidden patterns and group similar spatial entities together.

Identifying Spatial Clusters

We’ll provide examples of how to use clustering algorithms to find spatial clusters, such as identifying disease clusters or retail store groupings.

Practical Applications of Clustering

Spatial clustering has applications in various fields, from urban planning to epidemiology. We’ll delve into real-world use cases and their impact.

Spatial Prediction

Predictive modeling is a crucial aspect of spatial data analysis.

Predictive Modeling in Spatial Data

We’ll discuss how to build predictive models for spatial data using techniques like machine learning and kriging.

Kriging: Interpolating Spatial Data

Kriging is a geostatistical method used for spatial interpolation. It’s particularly useful when you need to estimate values at unsampled locations with spatial dependencies.

Machine Learning for Spatial Prediction

Machine learning algorithms, such as random forests and neural networks, can be applied to spatial data for accurate predictions. We’ll explore how to leverage these techniques.

Case Studies

To illustrate the practical applications of spatial statistics, we’ll delve into three real-world case studies.

Case 1: Epidemiology and Disease Mapping

Spatial statistics play a crucial role in tracking disease outbreaks and understanding their spatial distribution. We’ll explore how spatial analysis helps epidemiologists make informed decisions.

Case 2: Retail Store Location Analysis

Retailers use spatial analysis to optimize store locations, maximize sales, and reach target customers effectively. We’ll showcase how spatial statistics influence retail strategy.

Case 3: Environmental Modeling

In environmental science, spatial statistics aid in modeling and predicting phenomena like air quality, biodiversity, and land use. We’ll discuss how these models inform environmental policies.

Best Practices in Spatial Statistics

To wrap up our exploration of spatial statistics, we’ll highlight some best practices.

Data Preprocessing Tips

Effective data preprocessing sets the foundation for robust spatial analysis. We’ll provide tips and strategies for handling spatial data.

Model Selection and Evaluation

Choosing the right spatial model and evaluating its performance is critical. We’ll guide you through the model selection process and methods for assessing model accuracy.

Ethical Considerations in Spatial Analysis

Spatial analysis often involves sensitive data and has ethical implications. We’ll discuss the ethical considerations you should be aware of when working with spatial information.

Conclusion

Spatial statistics is a dynamic field that empowers data scientists to unlock valuable insights from spatial data. We’ve explored key concepts, practical tools in R, and real-world case studies. As the importance of spatial data continues to grow, mastering spatial statistics will be a valuable asset in your data science journey.

Spatial Statistics for Data Science: Theory and Practice with R (FAQs)

1. What is the main difference between spatial statistics and traditional statistics?

Spatial statistics focuses on data distributed in space and accounts for spatial dependencies, whereas traditional statistics assumes data points are independent.

2. Can I use R for spatial analysis if I’m new to programming?

Yes, R is beginner-friendly, and there are many resources available to help you get started with spatial analysis in R.

3. Are there any ethical considerations in spatial analysis?

Yes, spatial analysis often involves sensitive data, so ethical considerations, such as privacy and data security, are crucial.

4. What are some common applications of spatial clustering?

Spatial clustering is used in various fields, including epidemiology, ecology, and retail, to identify patterns and group similar spatial entities.

5. How can I improve my spatial data visualization skills in R?

You can enhance your spatial data visualization skills in R by exploring tutorials, practicing with real data, and experimenting with different plotting libraries.

Lean for free:

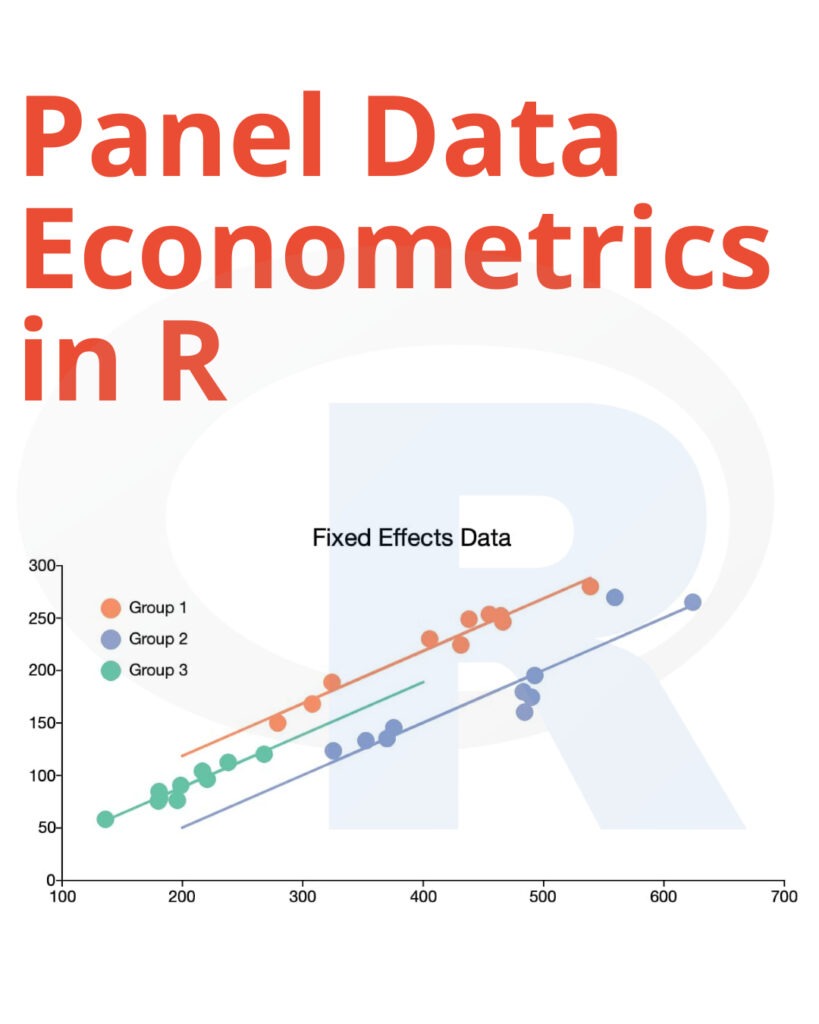
Download: Panel Data Econometrics in R: The plm Package

Introducing Python

Introducing Python: Python, often referred to as the “Swiss Army knife” of programming languages, is a versatile and powerful language that has become immensely popular in recent years. Its simplicity and readability make it an excellent choice for beginners, while its extensive libraries and frameworks cater to the needs of advanced programmers. In this article, we’ll take a deep dive into the world of Python, exploring its history, applications, and why it has captured the hearts of developers worldwide.

2. A Brief History of Python

Python was created in the late 1980s by Guido van Rossum, a Dutch programmer. Guido’s aim was to design a language that emphasized code readability and ease of use. He succeeded, and Python was officially released in 1991. Over the years, Python has evolved, with Python 2 and Python 3 being the two major versions. In 2020, Python 2 reached its end of life, emphasizing the importance of migrating to Python 3 for ongoing support and security updates.

3. Python’s Popularity in the Programming World

Python’s popularity has surged in recent years, and it consistently ranks among the top programming languages. The reasons for this popularity are manifold. Its clear and concise syntax allows developers to write code quickly and with fewer errors. Additionally, Python’s extensive standard library and third-party packages simplify complex tasks, making it suitable for various domains.

Introducing Python
Introducing Python

4. Python’s Syntax: Readability and Elegance

One of Python’s standout features is its readability. Its clean and well-structured syntax resembles plain English, making it easy for developers to understand and maintain code. This readability not only aids collaboration but also reduces the learning curve for newcomers, making Python an ideal choice for beginners.

5. Versatility of Python: What Can You Do?

Python’s versatility is perhaps its most remarkable trait. It is a multi-paradigm language, which means it supports various programming styles, including procedural, object-oriented, and functional programming. This versatility makes it suitable for a wide range of applications.

6. Python in Web Development

Python is widely used in web development, thanks to frameworks like Django and Flask. These frameworks simplify web application development, enabling developers to create powerful and secure web applications quickly.

7. Python in Data Science and Machine Learning

Python has emerged as the go-to language for data science and machine learning. Libraries like NumPy, pandas, and TensorFlow provide robust tools for data analysis, manipulation, and building machine learning models.

8. Python in Automation

Python’s simplicity makes it an excellent choice for automation tasks. Whether it’s automating repetitive processes or creating scripts for system administration, Python’s versatility shines in this domain.

9. Python in Game Development

Even in the world of game development, Python has a role to play. The Pygame library allows developers to create 2D games with ease, making it an attractive choice for game enthusiasts and indie developers.

10. Python Community and Resources

Python boasts a thriving community of developers and enthusiasts. Online forums, tutorials, and extensive documentation make learning Python a breeze. Developers can always find help and support when needed.

11. Learning Python: Where to Begin

If you’re eager to start your Python journey, there are plenty of online resources available. From interactive tutorials to comprehensive courses, you can choose a learning path that suits your needs and pace.

12. Python 2 vs. Python 3: The Transition

The transition from Python 2 to Python 3 was a significant milestone in Python’s history. While Python 2 was widely used, it’s crucial to migrate to Python 3 for ongoing support and compatibility with modern libraries and tools.

13. Python’s Future: What Lies Ahead

Python’s future looks promising. As the language continues to evolve, it will likely gain even more popularity and versatility. With advancements in areas like artificial intelligence and data science, Python is poised to play a pivotal role in shaping the technology landscape.

14. Conclusion

In conclusion, Python’s simplicity, versatility, and readability have made it a favorite among programmers of all levels. Whether you’re a beginner looking to learn your first programming language or an experienced developer seeking a powerful tool, Python has something to offer. Embrace Python, and you’ll open doors to a world of endless possibilities.

Introducing Python (FAQS)

Q1. Is Python a good language for beginners? Yes, Python’s readability and simplicity make it an excellent choice for beginners.

Q2. What can I do with Python? You can use Python for web development, data science, machine learning, automation, and more.

Q3. What’s the difference between Python 2 and Python 3? Python 2 has reached its end of life, and Python 3 is the recommended version for ongoing development.

Q4. Are there job opportunities for Python developers? Absolutely, Python developers are in high demand across various industries.

Q5. Where can I learn Python online? There are many online resources, including websites, tutorials, and courses, where you can learn Python at your own pace.

Download: Python for Everybody: Exploring Data Using Python 3

Panel Data Econometrics in R: The plm Package

In the world of econometrics, the analysis of panel data has become increasingly important. Panel data, also known as longitudinal data, involves observations of multiple entities over time. This type of data provides valuable insights into economic and social phenomena, making it a fundamental component of econometric research. In this article, we will explore the powerful “plm” package in R, which is a versatile tool for panel data econometrics.

Understanding Panel Data

Before delving into the “plm” package, it’s essential to grasp the concept of panel data. Panel data combines cross-sectional and time series data, enabling researchers to examine changes within individual entities over a period. The two main dimensions in panel data are:

Cross-sectional dimension (individuals or entities)

This dimension represents different entities such as companies, countries, or individuals. Each entity is observed over multiple time periods, creating a panel structure.

Time series dimension

The time series dimension comprises the various time points or periods when data is collected. It could be monthly, quarterly, yearly, or any other suitable interval.

Panel Data Econometrics in R

The plm Package: An Overview

Now that we understand panel data, let’s explore the “plm” package in R. This package is a powerful toolkit for panel data econometrics, offering a wide range of functionalities for data manipulation and analysis. Here are some key features:

1. Data Import and Transformation

The “plm” package provides functions for importing panel data and transforming it into a suitable format for analysis. Users can easily load data from CSV files or other sources, making it convenient for researchers dealing with diverse data sets.

2. Fixed Effects and Random Effects Models

One of the primary tasks in panel data analysis is modeling entity-specific effects. The “plm” package allows researchers to estimate fixed effects and random effects models, which are crucial for understanding the impact of individual entities on the dependent variable.

3. Robust Standard Errors

Robust standard errors are essential in panel data econometrics to account for heteroscedasticity and correlation in the data. The “plm” package offers robust standard error estimation, ensuring the reliability of the results.

4. First-Differencing and Within-Transformation

Researchers often need to differentiate or transform their data to eliminate unobserved heterogeneity. The “plm” package provides functions for first-differencing and within-transformation, simplifying these processes.

5. Hypothesis Testing

With the “plm” package, you can easily perform hypothesis tests on your panel data models. Whether you want to test the significance of coefficients or assess model fit, this package has you covered.

Getting Started with plm

To get started with the “plm” package, follow these steps:

Step 1: Installation

If you haven’t already installed the package, you can do so using the following command:

install.packages("plm")

Step 2: Loading the Package

After installation, load the package using:

library(plm)

Step 3: Importing Your Data

Use the appropriate functions to import your panel data into R.

Step 4: Model Estimation

Estimate your panel data models, whether it’s fixed effects, random effects, or other specifications, using the “plm” functions.

Conclusion

The “plm” package in R is a valuable resource for researchers and data analysts working with panel data econometrics. Its user-friendly functions and comprehensive capabilities make it an essential tool for understanding economic and social phenomena over time.

Incorporating panel data analysis into your research can provide deeper insights and improve the robustness of your econometric models. So, dive into the world of panel data econometrics with the “plm” package and unlock new dimensions of understanding in your data.

FAQs

  1. What is panel data econometrics? Panel data econometrics is a branch of econometrics that deals with data collected over time on multiple entities, allowing researchers to analyze both cross-sectional and time series variations.
  2. What are fixed effects and random effects models? Fixed effects models account for entity-specific effects, while random effects models capture unobserved heterogeneity in the data.
  3. Why is robust standard error estimation important in panel data analysis? Robust standard errors help correct for heteroscedasticity and correlation in the data, ensuring the validity of statistical tests.
  4. Can I use the “plm” package for other types of data analysis? While “plm” is primarily designed for panel data econometrics, it can also be used for other types of data analysis, depending on your research needs.
  5. Are there any tutorials or resources for learning more about the “plm” package? Yes, there are several online tutorials and documentation resources available to help you master the “plm” package in R.

Download(PDF)

Download: Learn Data Manipulation In R

Analyzing Linguistic Data A practical introduction to statistics using R

Welcome to the world of data analysis! In this comprehensive guide, we’ll take you on a journey through the fascinating realm of Analyzing Linguistic Data using R. Whether you’re a seasoned statistician or a beginner looking to dive into data analysis, this article has something for everyone. We’ll explore the fundamentals, delve into techniques, and provide insights that will help you master the art of linguistic data analysis.

Understanding Linguistic Data

Linguistic data analysis involves examining language-related information to extract valuable insights. This data can come from various sources, such as text documents, transcripts, or social media posts. By applying statistical techniques using R, you can uncover patterns, trends, and correlations within linguistic data.

The Power of R in Linguistic Data Analysis

R is a versatile and powerful programming language for statistical analysis. Its extensive library of packages makes it an ideal choice for linguistic data analysis. Here, we’ll explore some of the key reasons why R is the preferred tool for this task.

Analyzing Linguistic Data A practical introduction to statistics using R

Key Features of R for Linguistic Data Analysis

  1. Open-Source: R is freely available, making it accessible to all.
  2. Rich Graphical Capabilities: Create insightful visualizations to represent linguistic data.
  3. Statistical Packages: R boasts numerous packages specifically designed for linguistic analysis.
  4. Community Support: Join a thriving community of R users and access a wealth of knowledge.
  5. Data Manipulation: Easily manipulate linguistic data to suit your analysis needs.

Getting Started with R

Before we dive into linguistic data analysis, let’s ensure you’re comfortable with R. If you’re new to the language, don’t worry; we’ll guide you through the basics.

Analyzing Linguistic Data: A Practical Introduction to Statistics Using R

Now, let’s roll up our sleeves and start Analyzing Linguistic Data using R. We’ll cover a step-by-step process to help you navigate this fascinating journey.

Step 1: Data Collection

The first crucial step is gathering linguistic data. Identify your data sources and ensure data quality.

Step 2: Data Preprocessing

Clean and prepare your data. This step is essential for accurate analysis.

Step 3: Exploratory Data Analysis (EDA)

Explore your linguistic data using descriptive statistics and visualizations.

Step 4: Statistical Analysis

Apply statistical techniques such as regression, clustering, and hypothesis testing to gain insights.

Step 5: Interpretation and Insights

Interpret your findings and draw meaningful conclusions from linguistic data.

Step 6: Reporting and Visualization

Present your results effectively through reports and visualizations.

Frequently Asked Questions (FAQs)

Q: How can I access R for linguistic data analysis? A: You can download R for free from the official website (insert link). Additionally, there are various online resources and tutorials to help you get started.

Q: Is linguistic data analysis suitable for beginners? A: Yes, this article provides a practical introduction suitable for both beginners and experienced analysts.

Q: Can you recommend any R packages for linguistic data analysis? A: Certainly! Some popular packages include tm, quanteda, and NLP.

Q: Are there any online communities for R users interested in linguistic data analysis? A: Yes, you can join forums and communities like Stack Overflow and Cross Validated to connect with fellow R enthusiasts.

Q: What types of linguistic data can I analyze with R? A: R can analyze a wide range of linguistic data, including text documents, transcripts, social media posts, and more.

Q: How can I improve my skills in linguistic data analysis? A: Practice, explore different datasets, and keep learning from online courses and tutorials.

Conclusion

Analyzing Linguistic Data using R opens up a world of possibilities. With the right techniques and tools, you can unlock valuable insights from linguistic data, enhancing your decision-making and research capabilities. Embrace the power of R and embark on your journey to becoming a linguistic data analysis expert.

Download (PDF)

Download: A Handbook of Statistical Analyses Using R

Forecasting: Principles And Practice Using R

In today’s data-driven world, forecasting plays a pivotal role in making informed decisions. The ability to predict future trends, demands, and outcomes is crucial for individuals and businesses. In this comprehensive guide, we will delve into the principles and practice of forecasting using the powerful tool, R.

Introduction

Forecasting using R is not just a skill; it’s a strategic advantage. With the right techniques and tools, you can harness the power of data to make accurate predictions, whether it’s for financial planning, inventory management, or sales projections. This article will take you on a journey through the world of forecasting, equipping you with the knowledge and expertise to become a forecasting pro.

Understanding Forecasting: Principles And Practice Using R

Forecasting is the process of making predictions based on historical data and statistical models. R, a programming language and software environment for statistical computing and graphics, is widely used in the field of forecasting due to its versatility and extensive libraries.

Forecasting Principles And Practice Using R

Why Forecasting Matters

Forecasting is not just about making educated guesses; it’s about using data to make precise predictions. Here’s why it’s essential:

  1. Informed Decision-Making: Forecasting helps organizations make informed decisions by providing insights into future trends.
  2. Resource Optimization: It allows businesses to optimize resources, whether it’s managing inventory or allocating budgets.
  3. Risk Management: Understanding potential future scenarios enables better risk management.

Key Steps in Forecasting

To excel in forecasting using R, you need to follow a structured approach:

Data Collection and Preparation

Before you start forecasting, you must gather and clean your data. This step is crucial because the accuracy of your predictions depends on the quality of your data.

Model Selection

R offers various forecasting models, such as ARIMA, Exponential Smoothing, and Prophet. Choosing the right model depends on the nature of your data and the problem you’re trying to solve.

Model Training

Once you’ve selected a model, you’ll need to train it on historical data to learn patterns and trends.

Evaluation and Validation

After training, it’s essential to evaluate your model’s performance using validation techniques.

Forecasting and Visualization

Finally, you can use your trained model to make future predictions and visualize the results.

FAQs

How can I learn R for forecasting?

Learning R for forecasting can be done through online courses, tutorials, and books. Some excellent resources include Coursera’s “Practical Time Series Analysis” and the book “Forecasting: Principles and Practice” by Rob J Hyndman and George Athanasopoulos.

Are there any free resources for forecasting using R?

Yes, there are several free resources available. You can access R’s official documentation and tutorials on websites like R-bloggers and Stack Overflow. Additionally, many universities offer free online courses on R and forecasting.

Can R handle large datasets for forecasting?

Yes, R can handle large datasets, but it may require efficient coding and memory management techniques. You can also consider using packages like ‘bigmemory’ and ‘ff’ to work with large datasets in R.

What industries benefit from forecasting using R?

Forecasting using R is valuable across various industries, including finance, retail, healthcare, and manufacturing. It helps businesses make data-driven decisions and optimize their operations.

How can I ensure the accuracy of my forecasts?

To improve forecast accuracy, ensure your data is clean and choose the most suitable forecasting model. Regularly update and retrain your models as new data becomes available.

Are there any online communities for R and forecasting enthusiasts?

Yes, there are vibrant online communities and forums where R and forecasting enthusiasts share knowledge and experiences. Websites like Cross Validated and RStudio Community are great places to connect with experts and learners.

Conclusion

Forecasting: Principles and Practice using R empowers you to unlock the potential of data-driven predictions. Understanding the principles and following best practices allows you to make informed decisions, optimize resources, and thrive in an ever-changing world. Dive into the world of forecasting with R and gain a competitive edge in your field.

Download (PDF)

Download: R for Data Analysis in easy steps: R Programming Essentials

How To Code in Python 3

Welcome to the world of Python 3 programming! Whether you’re a beginner looking to dip your toes into coding or an experienced programmer venturing into Python, this guide will provide you with valuable insights, tips, and step-by-step instructions. In this article, we’ll explore the fundamentals of coding in Python 3, cover essential topics, and address common questions that may arise during your Python journey.

1. Getting Started with Python 3

Python is a versatile and beginner-friendly programming language. Let’s kick off our Python journey with the basics:

What is Python 3?

Python 3 is the latest version of Python, a high-level programming language known for its simplicity and readability. It’s widely used in web development, data analysis, artificial intelligence, and more.

Installing Python 3

To begin coding in Python 3, you need to install it on your computer. Visit the official Python website (link) and follow the installation instructions for your operating system.

Your First Python Program

Let’s write a simple “Hello, World!” program in Python to get started:

print("Hello, World!")
How To Code in Python 3

2. Python Syntax and Basics

Understanding the syntax and basics of Python is crucial. Let’s delve deeper:

Variables and Data Types

In Python, variables are used to store data. Common data types include integers, floats, strings, and booleans.

Control Flow

Learn about if statements, loops, and conditional statements to control the flow of your Python program.

Functions

Functions allow you to organize your code into reusable blocks. We’ll explore how to define and use functions effectively.

3. How To Code in Python 3

Let’s focus on the central topic:

Python Coding Best Practices

To write clean and maintainable Python code, follow these best practices. They include using meaningful variable names, proper indentation, and commenting on your code.

Debugging in Python

Discover techniques and tools for debugging your Python programs. We’ll cover common debugging issues and how to fix them.

4. Python Libraries and Frameworks

Python’s extensive library ecosystem makes it a powerful language. Here are some essential libraries and frameworks:

NumPy and pandas

For data manipulation and analysis, NumPy and pandas are indispensable. Learn how to use them effectively.

Django and Flask

If you’re interested in web development, Django and Flask are popular frameworks. We’ll introduce you to their basics.

5. FAQs about Python 3

Is Python 3 Hard to Learn?

Python’s simplicity makes it beginner-friendly. With dedication and practice, anyone can learn it.

What Can I Build with Python 3?

Python is incredibly versatile. You can create websites, build games, perform data analysis, and even work on machine learning projects.

How Do I Stay Updated with Python?

Python’s community is active. Follow Python-related blogs, forums, and attend meetups or conferences to stay updated.

Are There Job Opportunities for Python Developers?

Yes, Python developers are in high demand. Many companies look for Python expertise, especially in data science and web development.

How Do I Handle Python Errors?

Understanding error messages is key. Python provides descriptive error messages to help you identify and resolve issues.

What Are Some Advanced Python Topics?

Once you’ve mastered the basics, explore advanced topics like decorators, generators, and metaclasses to become a Python expert.

Conclusion

Congratulations! You’ve taken your first steps in learning how to code in Python 3. Python’s versatility and ease of use make it a valuable skill in today’s tech-driven world. Remember, practice is key to mastering Python, so keep coding and exploring new projects.

Download (PDF)

Download: Mastering Python Tricks for Efficient Coding

Free Harvard Courses to Learn Data Science

Free Harvard Courses to Learn Data Science: Are you interested in mastering the field of data science? Do you want to enhance your knowledge and skills in data analysis, visualization, and machine learning? Look no further than Harvard University, one of the world’s leading educational institutions. Harvard offers a range of free online courses that cater to aspiring data scientists. In this article, we will explore free Harvard courses to Learn Data Science to help you kick-start your journey into the fascinating world of data science.

Introduction

Data science has become an integral part of numerous industries, ranging from finance and healthcare to marketing and technology. The ability to analyze vast amounts of data and extract valuable insights has become a highly sought-after skill in today’s job market. Harvard University recognizes the importance of data science and has developed several courses to meet the growing demand for qualified professionals in this field.

Harvard University and Data Science

Harvard University, renowned for its academic excellence, offers a diverse range of educational programs across various disciplines. With its commitment to fostering innovation and pushing the boundaries of knowledge, Harvard has made significant contributions to the field of data science. The university’s data science courses provide learners with comprehensive training and practical experience to succeed in this rapidly evolving field.

Free Harvard Courses to Learn Data Science

Benefits of Learning Data Science

Before diving into the details of the specific courses, let’s explore the benefits of learning data science. By acquiring data science skills, you gain the ability to analyze complex datasets, make data-driven decisions, and solve real-world problems. Additionally, data science offers excellent career prospects, with a high demand for professionals who can extract valuable insights from data. Whether you are a student, a professional looking to switch careers, or an entrepreneur seeking to leverage data for business growth, learning data science can open up a world of opportunities.

Overview of Harvard’s Free Data Science Courses

Harvard University provides a range of free data science courses that cater to learners of all levels, from beginners to advanced practitioners. Let’s explore five standout courses that can equip you with the necessary knowledge and skills to excel in the field of data science.

Course 1: Introduction to Data Science

If you’d like to learn R, Harvard offers an introductory R course created specifically for data science learners, called Data Science: R Basics. This program will take you through R concepts like variables, data types, vector arithmetic, and indexing. You will also learn to wrangle data with libraries like dplyr and create plots to visualize data.

If you prefer Python, you can choose to take CS50’s Introduction to Programming with Python offered for free by Harvard. In this course, you will learn concepts like functions, arguments, variables, data types, conditional statements, loops, objects, methods, and more.

Course 2: Visualization

Visualization is one of the most powerful techniques with which you can translate your findings in data to another person. With Harvard’s Data Visualization program, you will learn to build visualizations using the ggplot2 library in R, along with the principles of communicating data-driven insights.

Course 3: Statistics

Statistical inference and modeling are indispensable for analyzing data affected by chance, and thus essential for data scientists. In this course, you will learn these key concepts through a motivating case study on election forecasting.

Course 4: Machine Learning

Perhaps the most popular data science methodologies come from machine learning. You will learn about training data, and how to use a set of data to discover potentially predictive relationships. As you build the movie recommendation system, you will learn how to train algorithms using training data so you can predict the outcome for future datasets. You will also learn about overtraining and techniques to avoid it such as cross-validation. All of these skills are fundamental to machine learning.

How to Enroll in Harvard’s Free Data Science Courses

Enrolling in Harvard’s free data science courses is a straightforward process. Simply visit the official Harvard online learning platform and browse the data science category. From there, you can select the course(s) that align with your interests and goals. Once enrolled, you will gain access to the course materials and can begin your learning journey immediately.

Tips for Success in Learning Data Science

Learning data science can be a challenging yet rewarding endeavor. To make the most out of your learning experience, consider the following tips:

Dedicate Time and Stay Consistent

Data science requires dedication and consistency. Set aside regular time slots for learning and ensure you stay committed to the coursework. Consistency is key to mastering the concepts and skills necessary for success in the field.

Seek Help and Collaborate

Don’t hesitate to seek help when faced with challenging concepts or problems. Online forums, communities, and peer support can provide valuable insights and clarification. Collaborating with fellow learners can also foster a sense of camaraderie and accelerate your learning process.

Practice Real-World Applications

Apply your data science skills to real-world problems whenever possible. Seek out datasets and create projects that simulate real-world scenarios. This practical experience will enhance your understanding and demonstrate your abilities to potential employers.

Conclusion

Harvard University offers an exceptional opportunity for individuals interested in data science to enhance their knowledge and skills. By enrolling in Harvard’s free data science courses, you can acquire valuable insights into data analysis, visualization, and machine learning. These courses provide a strong foundation and practical experience, preparing you for a successful career in data science.

Get started on your data science journey today by enrolling in Harvard’s free courses and unlocking the endless possibilities that data science has to offer.

FAQs

  1. Can I receive a certificate for completing these free Harvard data science courses?
    • No, these courses do not provide certificates of completion. However, the knowledge and skills gained from these courses can greatly benefit your professional development.
  2. Are these courses suitable for beginners with no prior data science experience?
    • Yes, these courses are designed to cater to learners of all levels, including beginners. The introductory courses provide a solid foundation, making them ideal for individuals with no prior data science experience.
  3. How long does it typically take to complete a Harvard data science course?
    • The duration of each course varies, but on average, learners can complete a course within 6-8 weeks by dedicating a few hours per week.
  4. Can I access the course materials even after completing the courses?
    • Yes, once enrolled in a course, you will have access to the course materials even after completing the course. This allows you to revisit the materials and reinforce your learning.
  5. Are there any prerequisites for enrolling in these courses?
    • While there are no strict prerequisites, having a basic understanding of programming concepts and mathematics can be beneficial. However, even without prior knowledge, the courses are designed to be accessible and comprehensible to learners from diverse backgrounds.

Download: The Art of Data Science: A Guide for Anyone Who Works with Data