Polynomial regression is a type of regression analysis in which the relationship between the independent variable x and the dependent variable y is modeled as an nth-degree polynomial. In R, you can perform polynomial regression using the lm() function, which fits a linear model.
Here’s an example of how to perform polynomial regression in R:
Suppose we have the following data:
x <- c(1, 2, 3, 4, 5)
y <- c(2, 6, 9, 10, 12)
We can fit a second-degree polynomial regression model using the lm() function as follows:
model <- lm(y ~ poly(x, 2, raw=TRUE))
In this case, poly(x, 2, raw=TRUE) creates a matrix of the predictors, where the columns are x raised to the power of 0, 1, and 2 (i.e., the intercept, x, and x^2). The raw=TRUE argument specifies that the predictors should not be standardized.
We can then use the summary() function to obtain the model summary:
summary(model)
This will output a summary of the model, including the coefficients, standard errors, t-values, and p-values for each predictor.
We can also use the predict() function to make predictions based on the model:
new_x <- seq(1, 5, length.out=100)
new_y <- predict(model, newdata=data.frame(x=new_x))
This will generate 100 new values of x and use the model to predict the corresponding values of y.
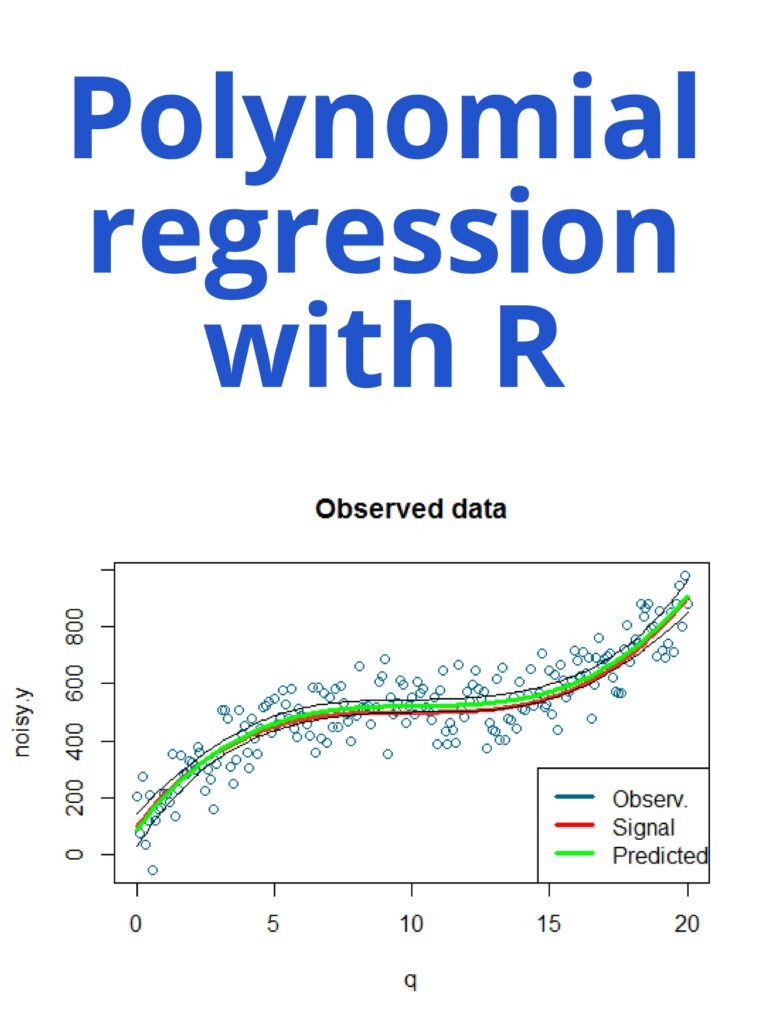
Finally, we can use the ggplot2 package to visualize the data and the fitted model:
library(ggplot2)
df <- data.frame(x, y, new_x, new_y)
ggplot(df, aes(x, y)) +
  geom_point() +
  geom_line(aes(x=new_x, y=new_y), color="blue")
This will create a scatter plot of the data points, overlaid with a blue line representing the fitted model.
