python

Modern Statistics: A Computer-Based Approach with Python

Modern Statistics is vital in analyzing and interpreting data in various domains. With the advent of technology, a computer-based approach has become increasingly popular in the field of statistics. In this article, we will explore the significance of modern statistics and its seamless integration with the Python programming language. We will delve into the essential statistical concepts, techniques, and tools while highlighting real-world applications and future trends. So, let’s embark on this journey to discover the power of modern statistics with Python.

Introduction to Modern Statistics

Modern Statistics is an interdisciplinary field that involves the collection, analysis, interpretation, presentation, and organization of data. It provides a framework for making informed decisions and drawing meaningful insights from complex datasets. In today’s data-driven world, the ability to extract valuable information from data is crucial for businesses, researchers, and policymakers.

A Computer-Based Approach with Python

Importance of Statistics in Data Analysis

Statistics plays a pivotal role in data analysis by providing a set of methods and techniques to analyze and interpret data. It helps in summarizing and describing data, identifying patterns and relationships, making predictions, and drawing conclusions. Statistics enables us to make informed decisions based on evidence rather than intuition or guesswork.

Advantages of a Computer-Based Approach in Statistics

A computer-based approach to statistics offers several advantages over traditional manual methods. It allows for efficient data handling, automated calculations, and the ability to work with large datasets. Additionally, computer-based approaches provide visualizations that aid in understanding complex relationships within the data. The use of statistical software, such as Python, enhances reproducibility, scalability, and collaboration in statistical analysis.

Overview of Python for Statistical Analysis

Python is a versatile and widely-used programming language that has gained popularity in the field of data analysis and statistics. Its simplicity, readability, and extensive ecosystem of libraries make it an ideal choice for statistical analysis. Python provides powerful tools for data manipulation, visualization, statistical modeling, and machine learning, making it a comprehensive platform for modern statistics.

Basic Statistical Concepts and Techniques

Before diving into the practical aspects of statistical analysis with Python, let’s establish a foundation by understanding some fundamental statistical concepts and techniques. These concepts include measures of central tendency (mean, median, and mode), measures of dispersion (variance and standard deviation), probability distributions, and hypothesis testing. Familiarity with these concepts is essential for conducting effective statistical analysis.

Mean, Median, and Mode

The mean represents the average value of a dataset, the median is the middle value, and the mode is the most frequently occurring value. These measures provide insights into the central tendency of data.

Variance and Standard Deviation

Variance measures the spread of data around the mean, while standard deviation is the square root of the variance. These measures quantify the dispersion or variability within a dataset.

Probability Distributions

Probability distributions describe the likelihood of different outcomes in a dataset. Common distributions include the normal distribution, binomial distribution, and Poisson distribution.

Hypothesis Testing

Hypothesis testing is a statistical method used to make inferences about a population based on sample data. It involves formulating null and alternative hypotheses, conducting statistical tests, and interpreting the results.

Exploratory Data Analysis with Python

Exploratory Data Analysis (EDA) is an essential step in the statistical analysis process. It involves examining and visualizing the data to gain insights and identify patterns, anomalies, and relationships. Python provides numerous libraries, such as Matplotlib and Seaborn, that facilitate data visualization and descriptive statistics.
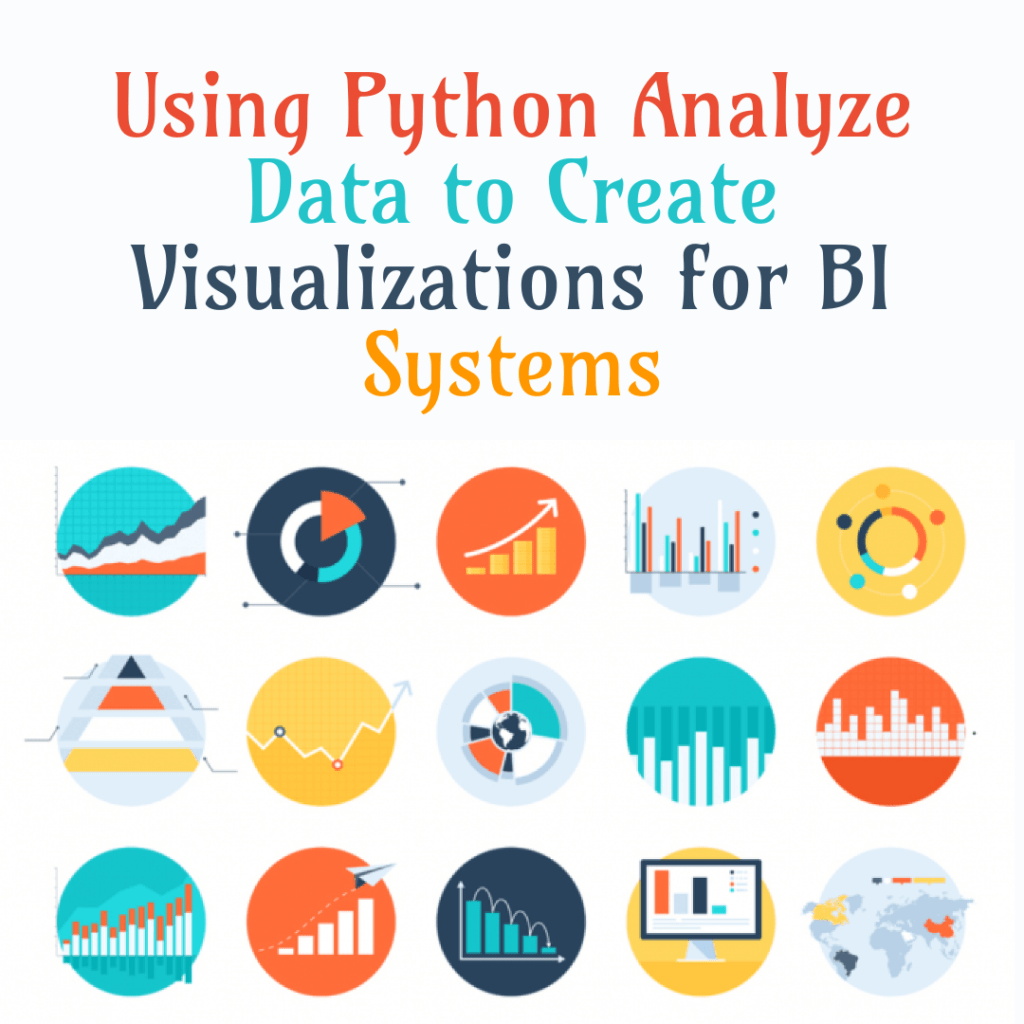
Data Visualization

Data visualization is a powerful tool for understanding and communicating data. Python libraries like Matplotlib and Seaborn offer a wide range of plots, such as scatter plots, histograms, and box plots, to visualize data distributions, correlations, and trends.

Descriptive Statistics

Descriptive statistics summarize and describe the main characteristics of a dataset. Measures like the mean, median, standard deviation, and correlation coefficients provide valuable insights into the data’s central tendency, dispersion, and relationships.

Correlation Analysis

Correlation analysis measures the strength and direction of the relationship between two or more variables. Python enables the calculation of correlation coefficients and the creation of correlation matrices to identify patterns and dependencies.

Statistical Modeling and Inference

Statistical modeling involves constructing mathematical models to represent relationships between variables and making predictions or inferences based on these models. Python offers powerful libraries, such as StatsModels and scikit-learn, to fit various statistical models and conduct inference.

Linear Regression

Linear regression is a widely-used statistical technique for modeling the relationship between a dependent variable and one or more independent variables. Python’s StatsModels library provides comprehensive functionality for fitting linear regression models and analyzing their statistical significance.

Logistic Regression

Logistic regression is a statistical technique used to model the probability of a binary outcome based on one or more independent variables. It is commonly used in classification problems. Python’s scikit-learn library offers efficient implementations of logistic regression models.

Time Series Analysis

Time series analysis deals with analyzing and forecasting data that is collected over time. Python provides libraries like StatsModels and Pandas for time series modeling, enabling the identification of trends, seasonality, and forecasting.

Machine Learning Techniques in Statistics

Machine learning techniques are increasingly being incorporated into statistical analysis workflows. Python’s scikit-learn library offers a wide range of machine-learning algorithms for classification, regression, clustering, and dimensionality reduction.

Classification Algorithms

Classification algorithms aim to predict categorical or discrete outcomes based on input features. Algorithms such as decision trees, random forests, and support vector machines are widely used in classification tasks.

Clustering Algorithms

Clustering algorithms group similar data points based on their similarity or distance measures. Python provides algorithms like k-means clustering and hierarchical clustering for unsupervised learning.

Decision Trees

Decision trees are hierarchical models that use a tree-like structure to make decisions based on input features. They are interpretable and can handle both categorical and numerical data.

Random Forests

Random forests are an ensemble learning method that combines multiple decision trees to improve prediction accuracy. They are robust against overfitting and handle high-dimensional datasets well.

Data Preprocessing and Cleaning

Data preprocessing and cleaning are crucial steps in statistical analysis to ensure the accuracy and reliability of results. Python provides tools and libraries for handling missing data, outliers, and feature scaling.

Missing Data Handling

Missing data can significantly impact statistical analysis. Python’s Pandas library offers methods for detecting and imputing missing values, ensuring complete and reliable datasets.

Outlier Detection and Treatment

Outliers are data points that deviate significantly from the rest of the dataset. Python provides various techniques, such as z-score analysis and box plots, to detect and handle outliers appropriately.

Feature Scaling and Normalization

Feature scaling and normalization ensure that variables are on similar scales, preventing certain features from dominating the analysis. Python provides functions and transformers for scaling and normalizing data.

Advanced Statistical Techniques with Python

Python supports advanced statistical techniques that go beyond the basics. These techniques include ANOVA and experimental design, factor analysis, survival analysis, and Bayesian statistics.

ANOVA and Experimental Design

Analysis of Variance (ANOVA) is a statistical technique used to compare means between two or more groups. Python’s SciPy library offers functions for performing ANOVA and designing experiments.

Factor Analysis

Factor analysis is a statistical technique used to identify underlying factors or latent variables in a dataset. Python’s FactorAnalyzer library provides functions for conducting factor analysis.

Survival Analysis

Survival analysis deals with time-to-event data, such as survival times or failure times. Python’s lifelines library offers tools for survival modeling and estimating survival probabilities.

Bayesian Statistics

Bayesian statistics is an approach to statistical inference that uses probability theory to update beliefs about unknown quantities. Python’s PyMC3 library provides a flexible framework for Bayesian modeling and analysis.

Integration of Statistical Analysis with Python Libraries

Python libraries such as NumPy, Pandas, Matplotlib, Seaborn, StatsModels, and scikit-learn facilitate statistical analysis by providing efficient and user-friendly tools.

NumPy for Numerical Computing

NumPy is a fundamental library for numerical computing in Python. It provides efficient data structures and functions for performing mathematical operations on arrays and matrices.

Pandas for Data Manipulation

Pandas is a powerful library for data manipulation and analysis. It provides data structures like DataFrames that enable easy handling of structured data and offers functions for data cleaning, transformation, and merging.

Matplotlib and Seaborn for Data Visualization

Matplotlib and Seaborn are widely-used libraries for creating visualizations in Python. They offer a variety of plots and customization options to present data effectively and aesthetically.

SciPy for Scientific Computing

SciPy is a library that extends the functionality of NumPy and provides additional scientific computing tools. It includes functions for optimization, interpolation, integration, and more.

StatsModels and scikit-learn for Statistical Modeling

StatsModels and scikit-learn are powerful libraries for statistical modeling and machine learning, respectively. They offer a wide range of models, algorithms, and evaluation metrics for comprehensive analysis.

Challenges and Limitations of Modern Statistics with Python

While Python and modern statistics offer numerous advantages, there are also challenges and limitations to consider. Some challenges include data quality issues, algorithm selection, and interpretability of complex models. Additionally, the scalability of certain algorithms may pose limitations for large-scale datasets.

Real-world Applications of Modern Statistics with Python

Modern statistics with Python finds applications in various fields, including finance, healthcare, marketing, social sciences, and more. It is used for fraud detection, risk analysis, customer segmentation, predictive modeling, and evidence-based decision-making.

Future Trends in Modern Statistics

As technology advances, modern statistics will continue to evolve. Future trends may include the integration of artificial intelligence and machine learning algorithms, advancements in deep learning, and the development of more efficient and scalable statistical methods.

Conclusion

Modern statistics with a computer-based approach using Python offers powerful tools and techniques for data analysis and interpretation. It enables researchers, analysts, and businesses to extract valuable insights from complex datasets. By leveraging the capabilities of Python libraries and embracing the fundamentals of statistical analysis, one can harness the power of modern statistics to make informed decisions and drive meaningful outcomes.

FAQs

1. Is Python the only language used for modern statistical analysis?

No, there are other programming languages like R, SAS, and Julia that are also popular for statistical analysis. However, Python’s versatility, ease of use, and extensive libraries make it a preferred choice for many statisticians and data analysts.

2. Do I need a strong programming background to perform statistical analysis with Python?

Having a basic understanding of programming concepts will certainly be beneficial. However, Python’s simplicity and extensive documentation make it accessible to individuals with varying levels of programming experience.

3. Can I perform machine learning tasks using Python for statistical analysis?

Absolutely! Python’s ecosystem of libraries, such as scikit-learn, provides powerful machine-learning algorithms for classification, regression, clustering, and more. These techniques can be seamlessly integrated into statistical analysis workflows.

4. How do I ensure the accuracy and reliability of my statistical analysis in Python?

Data preprocessing, cleaning, and validation are essential steps to ensure the accuracy and reliability of your analysis. It’s important to handle missing data appropriately, detect and treat outliers, and validate your results through cross-validation or other statistical techniques.

5. Where can I find additional resources to learn modern statistics with Python?

There are several online resources, tutorials, and books available to learn modern statistics with Python. Websites like DataCamp, Coursera, and Udemy offer courses specifically focused on statistical analysis using Python. Additionally, Python’s official documentation and community forums can provide valuable insights and guidance.

Download: Statistics and Data Visualization with Python

Python Packages

Python, a versatile and widely-used programming language, owes much of its popularity to the extensive collection of packages available for developers. Python packages are pre-written sets of code, modules, and resources that extend the functionality of Python and help streamline development processes. In this article, we will explore the world of Python package, their benefits, installation methods, best practices, and more.

Benefits of using Python Packages

Python packages offer numerous benefits to developers. Firstly, they save time and effort by providing ready-to-use code for common tasks. Instead of reinventing the wheel, developers can leverage existing packages and focus on solving unique challenges. Additionally, Python packages enhance code readability and maintainability by organizing functionality into modular units. They promote code reuse and collaboration, making it easier for teams to work together efficiently.

Python Packages

Popular Python packages and their applications

Python boasts a rich ecosystem of packages catering to diverse domains and use cases. Some of the most popular Python packages include:

  1. NumPy: A fundamental package for scientific computing with support for powerful array operations, linear algebra, and numerical computations.
  2. Pandas: Widely used for data manipulation and analysis, Pandas provides data structures and functions to handle structured data efficiently.
  3. Matplotlib: A versatile plotting library that enables the creation of static, animated, and interactive visualizations in Python.
  4. TensorFlow: Popular in the field of machine learning, TensorFlow offers a comprehensive set of tools for building and training neural networks.
  5. Django: A high-level web framework that simplifies web development by providing robust features for building scalable and secure web applications.

These packages are just a glimpse of the vast array of tools available in the Python ecosystem, catering to various domains such as data science, web development, artificial intelligence, and more.

How to install Python packages

Installing Python packages is a straightforward process. The most common method is using the pip package manager, which comes bundled with Python. Here are the steps to install a package using pip:

  1. Open your command-line interface or terminal.
  2. Type pip install package_name and press Enter. Replace package_name with the name of the package you want to install.
  3. Pip will download and install the package along with its dependencies.

Alternatively, you can use an integrated development environment (IDE) like PyCharm or Anaconda Navigator to install packages through a user-friendly interface.

Managing Python packages with pip

Once you have installed a Python package, pip provides various commands to manage them effectively. Here are some useful pip commands:

  1. pip list: Displays the installed packages and their versions.
  2. pip show package_name: Provides detailed information about a specific package.
  3. pip search package_name: Searches the Python Package Index (PyPI) for packages related to your query.
  4. pip install --upgrade package_name: Upgrades a package to the latest available version.
  5. pip uninstall package_name: Uninstalls a package from your Python environment.

Upgrading and uninstalling Python packages

Regularly updating Python packages is crucial to benefit from bug fixes, performance improvements, and new features. To upgrade a package, use the pip install --upgrade package_name command mentioned earlier. If you want to uninstall a package, utilize the pip uninstall package_name command.

Creating your own Python package

As a Python developer, you may find the need to create your own packages to encapsulate reusable code or share your work with others. Creating a Python package involves the following steps:

  1. Structuring your package directory with the required files and folders.
  2. Adding a setup.py file to define metadata and dependencies.
  3. Writing the package’s code and modules.
  4. Testing the package to ensure its functionality.
  5. Distributing the package by uploading it to PyPI or sharing it through version control systems like GitHub.

Best practices for using Python packages

To make the most out of Python packages, it’s essential to follow some best practices:

  1. Always use virtual environments to isolate package installations and avoid conflicts.
  2. Specify package versions in your project’s requirements file to ensure reproducibility.
  3. Document your code and provide clear instructions for others to use your packages.
  4. Contribute to open-source packages by reporting issues, submitting bug fixes, or adding new features.
  5. Stay updated with package releases and security advisories to maintain a secure development environment.

Troubleshooting common issues with Python packages

While using Python packages, you may encounter some common issues. Here are a few troubleshooting tips:

  1. If a package installation fails, ensure you have the necessary dependencies installed.
  2. Check the package’s documentation and online forums for solutions to common problems.
  3. If you encounter compatibility issues, try using a different version of the package or consult the package’s documentation for guidance.
  4. Make sure you are installing packages compatible with your Python version and operating system.

The future of Python packages

As Python continues to evolve, the ecosystem of Python packages will grow even larger. New packages will emerge, addressing the needs of emerging technologies and industries. With the increasing popularity of data science, machine learning, and web development, Python packages will play a vital role in driving innovation and empowering developers worldwide.

FAQs

FAQ 1: What are some essential Python packages for data analysis?

Some essential Python packages for data analysis include NumPy, Pandas, Matplotlib, and SciPy. These packages provide powerful tools for data manipulation, visualization, and statistical analysis.

FAQ 2: Can I use Python packages in different operating systems?

Yes, Python packages are designed to be cross-platform. They can be used in various operating systems such as Windows, macOS, and Linux, as long as the required dependencies are met.

FAQ 3: How can I contribute to an open-source Python package?

To contribute to an open-source Python package, you can start by exploring the package’s repository on platforms like GitHub. You can report issues, submit bug fixes, add new features, or even write documentation to help improve the package.

FAQ 4: Is it possible to use multiple versions of the same Python package?

Yes, it is possible to use multiple versions of the same Python package by utilizing virtual environments. Virtual environments allow you to create isolated Python environments with their own set of packages, including different versions.

FAQ 5: What should I do if I encounter a compatibility issue with a Python package?

If you encounter a compatibility issue with a Python package, you can try using a different version of the package that is compatible with your Python environment. Additionally, you can consult the package’s documentation or community forums for guidance on resolving compatibility issues.

Download: Python Data Science Essentials

Python Data Science Essentials

Python has emerged as one of the most popular programming languages for data science. Its simplicity, versatility, and rich ecosystem of libraries and tools make it an ideal choice for working with data. In this article, we will explore the essentials of Python data science, including its importance, setting up the environment, data manipulation, visualization, machine learning, deep learning, model deployment, relevant libraries and tools, best practices, challenges, and future trends.

1. Introduction to Python Data Science

Python data science involves using Python programming language for extracting insights and knowledge from data. It encompasses various tasks such as data cleaning, preprocessing, analysis, visualization, and machine learning. Python’s easy-to-learn syntax and extensive library support have made it a go-to language for data scientists.

Python Data Science Essentials

2. Importance of Python in Data Science

Python’s popularity in data science stems from its simplicity, readability, and extensive ecosystem. It provides an intuitive and user-friendly interface to handle complex data operations. Additionally, Python’s libraries, such as NumPy, Pandas, and Matplotlib, offer efficient and powerful tools for data manipulation, analysis, and visualization.

3. Setting up the Python Data Science Environment

Before diving into data science, it’s essential to set up the Python environment. This involves installing Python, along with relevant libraries and tools. Popular choices include Anaconda, which provides a comprehensive Python distribution, and Jupyter Notebooks, which offers an interactive coding environment.

4. Data Manipulation with Python

Data manipulation forms a crucial part of data science. Python provides several libraries, such as Pandas, that simplify data importing, cleaning, preprocessing, and transformation tasks. These libraries allow data scientists to handle various data formats, explore datasets, handle missing values, and create new features for analysis.

4.1 Importing and Exploring Data

Python’s Pandas library offers powerful functions to import data from various sources, including CSV files, databases, and web APIs. Once imported, data scientists can use Pandas’ functionalities to explore the dataset, understand its structure, and get basic statistical insights.

4.2 Data Cleaning and Preprocessing

Data cleaning involves identifying and handling missing values, outliers, and inconsistent data. Python provides tools like Pandas and NumPy that enable efficient data cleaning and preprocessing. These libraries offer functions for imputing missing values, removing outliers, and transforming data into a suitable format for analysis.

4.3 Data Transformation and Feature Engineering

Data transformation involves converting raw data into a suitable format for analysis. Python libraries like Pandas provide functions for transforming variables, scaling data, and encoding categorical features. Feature engineering, on the other hand, involves creating new features from existing ones to improve model performance. Python’s libraries offer numerous techniques for feature engineering, such as one-hot encoding, binning, and polynomial features.

5. Data Visualization with Python

Data visualization plays a vital role in understanding and communicating insights from data. Python offers several libraries, including Matplotlib, Seaborn, and Plotly, that facilitate the creation of static and interactive visualizations. These libraries provide a wide range of plot types, customization options, and interactive features to effectively convey data patterns and relationships.

5.1 Plotting Libraries and Packages

Matplotlib is a popular plotting library in Python that provides a flexible and comprehensive set of functions for creating static visualizations. Seaborn, built on top of Matplotlib, offers additional functionalities for statistical visualizations. Plotly, on the other hand, specializes in interactive and web-based visualizations.

5.2 Creating Basic and Advanced Visualizations

Python’s plotting libraries allow data scientists to create a variety of visualizations, including scatter plots, line charts, bar graphs, histograms, heatmaps, and more. With customizable options, labels, and annotations, Python enables the creation of visually appealing and informative plots.

5.3 Interactive Visualizations with Python

Interactive visualizations enhance the data exploration experience by allowing users to interact with the plots. Python libraries like Plotly, Bokeh, and Altair provide interactive capabilities, enabling zooming, panning, hovering, and filtering on the visualizations. These libraries are particularly useful for creating dashboards and interactive web applications.

6. Machine Learning with Python

Machine learning is a core component of data science. Python offers numerous libraries, such as Scikit-learn and TensorFlow, that simplify the implementation of machine learning algorithms. These libraries provide a wide range of supervised and unsupervised learning models, as well as tools for model evaluation and selection.

6.1 Introduction to Machine Learning

Machine learning involves training models on data to make predictions or take actions without being explicitly programmed. Python provides a comprehensive set of tools and libraries for various machine-learning tasks, such as classification, regression, clustering, and dimensionality reduction.

6.2 Supervised Learning Algorithms

Supervised learning algorithms learn from labeled data to make predictions or classify new instances. Python’s Scikit-learn library offers a vast collection of supervised learning algorithms, including linear regression, logistic regression, support vector machines, decision trees, and random forests.

6.3 Unsupervised Learning Algorithms

Unsupervised learning algorithms discover patterns and structures in unlabeled data. Python’s Scikit-learn provides a range of unsupervised learning algorithms, such as clustering (k-means, hierarchical clustering) and dimensionality reduction techniques (principal component analysis, t-SNE).

6.4 Model Evaluation and Selection

Evaluating and selecting the best model is crucial for successful machine learning. Python’s Scikit-learn offers functions for assessing model performance using various metrics, such as accuracy, precision, recall, and F1-score. Cross-validation techniques and hyperparameter tuning help optimize model performance and generalize well to unseen data.

7. Deep Learning with Python

Deep learning has revolutionized many areas of data science, including computer vision, natural language processing, and reinforcement learning. Python’s TensorFlow and Keras libraries provide powerful frameworks for building and training deep neural networks.

7.1 Neural Networks and Deep Learning

Neural networks are computational models inspired by the human brain. Deep learning involves training neural networks with multiple hidden layers. Python’s TensorFlow and Keras libraries provide high-level APIs for defining and training neural networks, making them accessible even to beginners.

7.2 Building Deep Learning Models with Python

Python’s TensorFlow and Keras libraries offer a wide range of pre-built layers and models, enabling data scientists to create deep learning models with ease. These libraries also support custom model architectures and provide tools for fine-tuning and transfer learning.

7.3 Training and Fine-tuning Models

Deep learning models require significant computational resources and training data. Python’s libraries support training models on CPUs, GPUs, and distributed systems. Transfer learning allows leveraging pre-trained models on large datasets to improve performance on specific tasks with limited data.

7.4 Applications of Deep Learning in Data Science

Deep learning has found applications in various domains, such as image classification, object detection, natural language processing, and recommendation systems. Python’s deep learning libraries enable data scientists to tackle complex problems and extract meaningful insights from unstructured data.

8. Deploying Python Data Science Models

Deploying data science models to production is crucial for real-world impact. Python offers several options for deploying models, including creating APIs, building web applications and dashboards, and leveraging cloud services for scalability.

8.1 Model Deployment Options

Python provides frameworks like Flask and Django for creating APIs that expose data science models as web services. These APIs allow other applications to make predictions or retrieve insights from the models. Additionally, deploying models as web applications or dashboards provides a user-friendly interface for interacting with the models.

8.2 Building APIs with Python

Python’s Flask and Django frameworks simplify the creation of APIs. They handle routing, request handling, and response generation, making it easier to expose data science models as web services. With Python, data scientists can create RESTful APIs that can be integrated into various applications.

8.3 Web Applications and Dashboards

Python’s web frameworks, such as Flask and Django, enable data scientists to build interactive web applications and dashboards. These applications provide a graphical interface for users to input data, visualize results, and interact with the underlying data science models.

8.4 Cloud Deployment and Scalability

Cloud services like Amazon Web Services (AWS), Microsoft Azure, and Google Cloud Platform (GCP) offer scalable infrastructure for deploying data science models. Python provides libraries and SDKs for interacting with cloud services, allowing data scientists to leverage cloud computing resources and easily scale their applications.

9. Python Data Science Libraries and Tools

Python’s data science ecosystem is rich with libraries and tools that enhance productivity and extend functionality. Some essential libraries for data science include NumPy, Pandas, Matplotlib, SciPy, Scikit-learn, and TensorFlow. Jupyter Notebooks and integrated development environments (IDEs) like PyCharm and Visual Studio Code provide a seamless coding experience.

9.1 NumPy, Pandas, and Matplotlib

NumPy is a fundamental library for numerical computations in Python. It provides support for multi-dimensional arrays and efficient mathematical operations. Pandas, built on top of NumPy, offers high-level data structures and functions for data manipulation and analysis. Matplotlib enables the creation of various plots and visualizations.

9.2 SciPy, Scikit-learn, and TensorFlow

SciPy is a library that builds on NumPy and provides additional scientific and numerical computing capabilities. It offers functions for optimization, integration, interpolation, and more. Scikit-learn is a versatile machine-learning library that provides tools for data preprocessing, model selection, and evaluation. TensorFlow, developed by Google, is a powerful framework for building and training machine learning and deep learning models.

9.3 Jupyter Notebooks and IDEs

Jupyter Notebooks provide an interactive and collaborative coding environment for data scientists. They allow for combining code, visualizations, and narrative explanations in a single document. Integrated development environments like PyCharm and Visual Studio Code offer powerful features such as code debugging, version control integration, and code suggestions, enhancing the development experience.

10. Best Practices in Python Data Science

Adhering to best practices ensures efficient and reproducible data science workflows. It involves considerations such as data exploration, version control, documentation, testing, and performance optimization.

10.1 Data Science Workflow

A well-defined data science workflow encompasses steps such as problem formulation, data collection, data preprocessing, model development, model evaluation, and deployment. Following a structured workflow improves productivity and ensures the reliability of results.

10.2 Version Control and Collaboration

Version control systems like Git enable tracking changes in code and collaboration among team members. Using Git repositories ensures proper documentation, allows for reverting changes, and facilitates collaboration on data science projects.

10.3 Documentation and Testing

Documentation is essential for maintaining code readability and understanding. Data scientists should document their code, including functions, classes, and workflows, to enable easy comprehension by others. Testing the code with appropriate test cases ensures its correctness and reliability.

10.4 Performance Optimization

Python provides optimization techniques, such as vectorization and parallelization, to improve code performance. Additionally, using optimized libraries and data structures, caching results, and optimizing algorithms can significantly enhance the speed and efficiency of data science workflows.

11. Challenges and Future Trends in Python Data Science

As data science evolves, new challenges and trends emerge. Data scientists need to be aware of these challenges and stay updated with the latest advancements to stay competitive.

11.1 Big Data and Distributed Computing

As the volume of data grows, processing and analyzing big data become challenging. Distributed computing frameworks like Apache Hadoop and Apache Spark, along with Python libraries like PySpark, address these challenges by enabling distributed data processing and analysis.

11.2 Explainable AI and Ethical Considerations

As AI and machine learning models become more complex, explainability becomes crucial. Data scientists need to interpret and explain the decisions made by models. Additionally, ethical considerations, such as bias in data and models, fairness, and privacy, need to be addressed in data science projects.

11.3 Automation and AutoML

Automated machine learning (AutoML) techniques aim to automate various stages of the data science workflow, from data preprocessing to model selection and tuning. Python libraries like H2O and Auto-Sklearn provide AutoML capabilities, making it easier for non-experts to leverage data science.

11.4 Reinforcement Learning and AI Integration

Reinforcement learning, a branch of machine learning, focuses on training agents to make decisions through trial and error. Python libraries like OpenAI Gym enable reinforcement learning experimentation. Integration of AI into various domains, such as healthcare, finance, and robotics, is an emerging trend.

FAQs

Q1: Is Python the best programming language for data science? Yes, Python is widely regarded as one of the best programming languages for data science due to its extensive libraries, ease of use, and versatility.

Q2: What are some popular Python libraries for data science? Some popular Python libraries for data science include NumPy, Pandas, Matplotlib, Scikit-learn, TensorFlow, and Keras.

Q3: Can I use Python for both machine learning and deep learning? Absolutely! Python provides libraries like Scikit-learn for traditional machine learning and TensorFlow and Keras for deep learning.

Q4: Are there any challenges in data science that Python can’t handle? While Python is a powerful language for data science, handling extremely large-scale data processing might require distributed computing frameworks like Apache Spark.

Q5: Where can I learn Python for data science? There are several online resources, tutorials, and courses available for learning Python for data science. Websites like Coursera, Udemy, and DataCamp offer comprehensive courses for beginners and experienced professionals.

Download: Think Python: How to Think Like a Computer Scientist

Fluent Python

In this article, we will explore the concept of “Fluent Python” and its significance in writing high-quality, readable, and efficient Python code. Fluent Python refers to the practice of using Python’s idiomatic features and coding style to write expressive and concise code that is easy to understand and maintain. By leveraging the full potential of Python’s language constructs and libraries, developers can create more elegant and effective solutions to programming problems. In this article, we will delve into the benefits of writing Fluent Python code and provide tips to enhance your Python programming skills.

What is Fluent Python?

Fluent Python can be described as a programming paradigm that emphasizes writing code that reads like a well-crafted piece of literature. It focuses on using the native features of Python to their fullest extent, allowing developers to express complex ideas in a clear and concise manner. Fluent Python code is not only easy to read and understand but also enables efficient collaboration among team members.

Fluent Python

Benefits of Fluent Python

Pythonic Code

It encourages the use of Pythonic code, which means utilizing the language’s unique features, conventions, and idioms. Pythonic code is often more expressive, succinct, and efficient than code written in a non-Pythonic style. It follows the principles of simplicity, readability, and explicitness, making it easier to write, debug, and maintain.

Python Decorators

Decorators are a powerful feature of Python that allows the modification or extension of the behavior of functions or classes. It promotes the use of decorators to add functionality to code without modifying its source. By leveraging decorators, developers can separate cross-cutting concerns and achieve cleaner and more modular code.

List Comprehensions

List comprehensions provide a concise and expressive way to create lists based on existing iterables or sequences. They allow developers to perform complex transformations, filtering, and mapping operations in a single line of code. Fluent Python encourages the use of list comprehensions to improve code readability and reduce the need for explicit looping constructs.

Context Managers

Context managers enable the efficient management of resources, such as files or network connections, by automatically handling their setup and cleanup. Fluent Python emphasizes the use of context managers, especially the with statement, to ensure proper resource management and avoid resource leaks. Context managers enhance code reliability and simplify error handling.

Generators

Generators are a powerful tool for creating iterators in Python. They allow the lazy evaluation of values, which can be especially useful when dealing with large datasets or infinite sequences. It promotes the use of generators to enhance code performance and memory efficiency. By using generators, developers can write code that consumes fewer resources and executes faster.

Magic Methods

Magic methods, also known as dunder methods, are special methods in Python that provide hooks into the language’s behavior. They allow customization and overriding of default operations, such as arithmetic operations or object comparisons. It encourages the appropriate use of magic methods to create more intuitive Pythonic APIs.

Function Annotations

Function annotations are a feature introduced in Python 3 that allows developers to associate arbitrary metadata with function parameters and return values. Fluent Python encourages the use of function annotations to provide additional information about the intended usage of functions and improve code clarity. Annotations can also be leveraged by static analysis tools and IDEs to provide better code hints and type checking.

Concurrency

Concurrency is an essential aspect of modern software development. Fluent Python promotes the use of Python’s built-in concurrency libraries, such as asyncio, to write efficient and scalable concurrent code. By leveraging Python’s concurrency features, developers can create highly responsive applications that make efficient use of system resources.

Tips for Writing Fluent Python Code

  1. Master Python’s Built-in Data Structures: Understand the characteristics and usage patterns of data structures like lists, dictionaries, sets, and tuples. Choose the appropriate data structure based on your specific needs to write more expressive and efficient code.
  2. Leverage Python’s Standard Library: Python’s standard library offers a wide range of modules and packages that provide ready-to-use functionality for various tasks. Familiarize yourself with the standard library and utilize its features to avoid reinventing the wheel and write more maintainable code.
  3. Follow Python’s Style Guide (PEP 8): Adhering to Python’s official style guide ensures consistency and readability across your codebase. Use meaningful variable and function names, follow the recommended indentation style, and maintain a consistent code structure.
  4. Use Descriptive Comments: Comments can greatly improve code understanding, especially for complex or non-obvious sections. Write clear and concise comments that explain the intention and logic behind your code. Avoid redundant comments that simply restate the code’s functionality.
  5. Write Unit Tests: Unit tests are crucial for verifying the correctness of your code and catching potential bugs early on. Adopt a test-driven development approach and write comprehensive unit tests that cover different code paths and edge cases.
  6. Refactor Regularly: Refactoring involves restructuring your code without changing its external behavior. Regular refactoring helps improve code clarity, maintainability, and performance. Take the time to revisit and refactor your code as you gain a better understanding of the problem domain.

FAQs

Q1: Can I write Fluent Python code in any Python version? Yes, Fluent Python principles can be applied to code written in any version of Python. However, some features, such as function annotations, are available only in Python 3 and above.

Q2: Is Fluent Python suitable for beginners? Fluent Python is more beneficial for intermediate to advanced Python developers who are already familiar with the language’s basics. Beginners can still learn from Fluent Python concepts, but it’s recommended to have a solid foundation in Python first.

Q3: Will writing Fluent Python code improve the performance of my applications? Fluent Python code focuses on code readability and expressiveness rather than direct performance improvements. However, by following best practices and utilizing appropriate language features, you can write code that is both readable and performant.

Q4: Are there any drawbacks to writing Fluent Python code? One potential drawback is that overly complex or convoluted expressions can make code less readable, especially for novice Python developers. It’s important to strike a balance between conciseness and clarity when applying Fluent Python concepts.

Download(PDF)

Download: Think Python: How to Think Like a Computer Scientist

Think Python: How to Think Like a Computer Scientist

Welcome to the world of Python programming! In this article, we will explore how to think like a computer scientist by diving into the fundamentals of Python and understanding its unique approach to problem-solving. Whether you’re a beginner or an experienced programmer, this guide will provide valuable insights into Python’s simplicity, power, and applications in various fields.

What is Python?

Python is a high-level programming language known for its simplicity and readability. Created by Guido van Rossum in the late 1980s, Python has gained immense popularity due to its easy-to-understand syntax and versatility. It is an interpreted language, meaning that the code is executed line by line without the need for compilation, which makes it ideal for rapid development and prototyping.

Think Python How to Think Like a Computer Scientist

Why Learn Python?

Before delving into how to think like a computer scientist using Python, let’s first understand why learning Python is worth your time and effort. Here are a few compelling reasons:

  1. Versatility: Python can be used for a wide range of applications, including web development, data analysis, machine learning, scientific computing, and more. Its extensive library ecosystem makes it a favorite among developers.
  2. Ease of Use: Python’s clear and concise syntax makes it beginner-friendly. It emphasizes code readability, allowing programmers to express concepts in fewer lines of code compared to other languages.
  3. Job Market Demand: Python’s popularity has skyrocketed in recent years, leading to a surge in demand for Python developers. Learning Python can open up numerous career opportunities in the tech industry.

Thinking Like a Computer Scientist

To truly excel in Python programming, it’s essential to adopt the mindset of a computer scientist. This involves approaching problems systematically, breaking them down into smaller, manageable components, and leveraging computational thinking to develop efficient solutions. By thinking like a computer scientist, you’ll gain a deeper understanding of problem-solving strategies and learn to write more robust and scalable code.

How to Approach Python Programming

When embarking on your Python programming journey, it’s crucial to follow a structured approach. Here are some steps to help you get started:

1. Master the Basics

Begin by grasping the core concepts of Python, such as variables, data types, operators, and basic input/output operations. Familiarize yourself with the fundamental building blocks of the language.

2. Control Flow and Loops

Learn about conditional statements, loops, and branching mechanisms to control the flow of your program. Understand how to make decisions and repeat actions based on specific conditions.

3. Functions and Modules

Explore the concept of functions, which allow you to encapsulate reusable blocks of code. Dive into module usage to organize your code into separate files for better maintainability.

4. Object-Oriented Programming

Delve into the world of object-oriented programming (OOP) and understand how to create classes, objects, and inheritance hierarchies. OOP provides a powerful paradigm for structuring and organizing code.

5. File Handling

Learn how to read from and write to files using Python’s file-handling capabilities. Discover how to manipulate file data, handle exceptions, and ensure data integrity.

6. Exception Handling

Explore the importance of exception handling in Python programming. Understand how to gracefully handle errors, prevent program crashes, and provide informative error messages to users.

7. Testing and Debugging

Become proficient in testing and debugging techniques to identify and fix errors in your code. Learn about unit testing, debugging tools, and best practices for writing robust and error-free programs.

Python’s Simplicity and Power

One of Python’s defining features is its simplicity without sacrificing power. Its expressive syntax enables developers to write concise and readable code, making it easier to maintain and collaborate on projects. Python’s vast standard library and extensive third-party packages provide a rich ecosystem of tools and resources to tackle complex tasks efficiently.

FAQs

Q1: Is Python a good language for beginners? A1: Absolutely! Python’s clear and concise syntax, along with its beginner-friendly nature, makes it an excellent choice for those starting their programming journey.

Q2: Can Python be used for web development? A2: Yes, Python is widely used for web development. Frameworks like Django and Flask provide powerful tools to build robust and scalable web applications.

Q3: Is Python suitable for data analysis and machine learning? A3: Definitely! Python has become the de facto language for data analysis and machine learning. Libraries such as NumPy, Pandas, and TensorFlow offer extensive support for these domains.

Q4: What resources can I use to learn Python? A4: There are numerous online tutorials, courses, and books available to learn Python. Some popular resources include Codecademy, Coursera, and the official Python documentation.

Q5: How can Python benefit my career? A5: Python’s rising popularity has led to increased demand for Python developers across various industries. Learning Python can open up diverse career opportunities and enhance your marketability.

Download (PDF)

Download: Effective Python

Statistics and Data Visualization with Python

Statistics and data visualization play crucial roles in analyzing and interpreting data, enabling us to gain valuable insights and make informed decisions. With the increasing availability of data, it has become essential to have effective tools and techniques to process and present data visually. Python, a versatile programming language, offers powerful libraries that make statistical analysis and data visualization accessible to both beginners and experienced professionals.

Introduction

In today’s data-driven world, businesses, researchers, and individuals need to harness the power of data to derive meaningful conclusions and drive growth. Statistics provides the foundation for understanding and summarizing data, while data visualization enables us to communicate complex information visually. Python, with its extensive set of libraries, has emerged as a popular language for performing statistical analysis and creating impactful data visualizations.

Statistics and Data Visualization with Python

Importance of Statistics and Data Visualization

Enhancing data understanding and insights

Statistics allows us to explore data and uncover patterns, trends, and relationships. By applying statistical techniques, we can summarize large datasets, identify outliers, and gain a deeper understanding of the underlying distributions. This knowledge helps us make informed decisions and predictions based on evidence rather than intuition alone.

Data visualization complements statistics by representing data in a visual format. Visualizations help us perceive patterns and relationships that may not be apparent from raw data alone. Through graphs, charts, and interactive dashboards, we can communicate complex information more effectively, enabling stakeholders to grasp insights quickly and make data-driven decisions.

Supporting decision-making processes

Both statistics and data visualization are crucial for decision-making processes. Statistical analysis helps us evaluate hypotheses, test the significance of results, and quantify uncertainty. With statistical techniques, we can assess the effectiveness of interventions, identify factors influencing outcomes, and optimize strategies.

Data visualization provides an intuitive way to present data and results to decision-makers. It allows them to see trends, compare variables, and understand the impact of different scenarios. By conveying information visually, data visualization facilitates faster comprehension, leading to more informed and confident decision-making.

Python as a Powerful Tool for Statistics and Data Visualization

Python has gained popularity in the field of data science and analytics due to its simplicity, versatility, and extensive libraries. It offers a rich ecosystem of tools specifically designed for statistical analysis and data visualization. Python’s readability and user-friendly syntax make it accessible to users with varying levels of programming experience.

Key Python Libraries for Statistics and Data Visualization

To perform statistical analysis and create compelling data visualizations in Python, several key libraries are commonly used. These libraries provide a wide range of functionalities and make complex operations more accessible.

NumPy

NumPy is a fundamental library for numerical computing in Python. It provides powerful tools for working with arrays and matrices, enabling efficient and fast computation of mathematical operations. NumPy forms the foundation for many other libraries in the scientific Python ecosystem.

Pandas

Pandas is a versatile library that simplifies data manipulation and analysis. It provides data structures, such as dataframes, which allow for easy handling of structured data. Pandas offers a wide range of functionalities for filtering, aggregating, and transforming data, making it an essential tool for data preprocessing.

Matplotlib

Matplotlib is a popular data visualization library in Python. It offers a wide range of plotting functions and customization options, allowing users to create static, animated, and interactive visualizations. With Matplotlib, you can generate various types of charts, including line plots, bar plots, scatter plots, and histograms.

Seaborn

Seaborn is built on top of matplotlib and provides a high-level interface for creating visually appealing statistical graphics. It simplifies the creation of complex visualizations, such as heatmaps, violin plots, and pair plots. Seaborn also offers additional statistical functionalities, enhancing the analysis process.

Exploring Descriptive Statistics with Python

Descriptive statistics help us summarize and understand the characteristics of a dataset. With its statistical libraries, Python makes it straightforward to calculate descriptive statistics.

Mean, median, and mode

The mean represents the average value of a dataset, providing a measure of central tendency. The median represents the middle value, separating the higher and lower halves of the dataset. The mode identifies the most frequent value or values in the dataset.

Measures of dispersion

Measures of dispersion, such as the standard deviation and variance, indicate the spread or variability of data. They provide insights into the distribution of values and the degree of deviation from the mean.

Frequency distributions

Frequency distributions organize data into intervals or bins and display the number of occurrences or frequencies within each interval. Python’s libraries offer functions to calculate and visualize frequency distributions effectively.

Conducting Inferential Statistics with Python

Inferential statistics allow us to make inferences or draw conclusions about populations based on sample data. Python provides powerful tools for conducting inferential statistics.

Hypothesis testing

Hypothesis testing is a statistical method for making decisions or drawing conclusions about a population based on sample data. Python’s statistical libraries offer functions to perform hypothesis tests, such as t-tests and chi-square tests, allowing us to evaluate hypotheses and determine the statistical significance of results.

Confidence intervals

Confidence intervals provide a range of values within which we can expect the population parameter to fall with a certain level of confidence. Python’s libraries offer functions to calculate confidence intervals, helping us estimate the precision of our sample estimates.

Regression analysis

Regression analysis allows us to model and analyze the relationship between variables. Python’s libraries provide a variety of regression models, such as linear regression, logistic regression, and polynomial regression. These models help us understand how variables interact and make predictions based on observed data.

Creating Effective Data Visualizations with Python

Python’s libraries offer powerful tools for creating impactful data visualizations that enhance data communication and storytelling.

Basic plots with Matplotlib

Matplotlib provides a wide range of plotting functions to create basic visualizations. With Matplotlib, you can generate line plots, bar plots, scatter plots, pie charts, and more. It also allows customizing colors, labels, and other visual elements to create visually appealing visualizations.

Advanced visualizations with Seaborn

Seaborn extends Matplotlib’s capabilities by offering higher-level functions for complex visualizations. It simplifies the creation of statistical graphics, such as box plots, violin plots, and swarm plots. Seaborn’s default styles and color palettes make it easy to create professional-looking visualizations.

Interactive Data Visualizations with Python

In addition to static visualizations, Python provides libraries for creating interactive data visualizations that engage users and allow for exploration and analysis.

Plotly

Plotly is a powerful library for creating interactive visualizations, including charts, graphs, maps, and dashboards. It offers a wide range of customization options and interactive features, such as hover effects, zooming, and panning. With Plotly, you can create interactive plots that respond to user interactions, providing a dynamic and engaging data exploration experience.

Bokeh

Bokeh is another popular library for interactive data visualizations in Python. It focuses on creating interactive visualizations for the web, allowing users to interact with data using tools like hover tooltips, zooming, and selection. Bokeh supports a variety of plot types and offers seamless integration with web technologies, making it suitable for creating interactive dashboards and web applications.

Real-World Applications of Statistics and Data Visualization with Python

The applications of statistics and data visualization with Python are vast and span across various industries and domains.

Business Analytics

In business analytics, statistical analysis and data visualization are instrumental in understanding customer behavior, and market trends, and optimizing business processes. Python’s libraries provide the necessary tools to analyze sales data, identify customer segments, and create visualizations that support strategic decision-making. By leveraging statistical techniques and visualizations, businesses can gain insights that drive growth and competitiveness.

Healthcare analytics

In healthcare, statistics and data visualization play a crucial role in analyzing patient data, identifying patterns, and improving healthcare outcomes. Python’s libraries enable healthcare professionals to perform statistical analysis on patient data, conduct epidemiological studies, and create visualizations that aid in disease surveillance and treatment evaluation. The combination of statistical analysis and data visualization enhances medical research, policy-making, and patient care.

Social sciences

In the social sciences, statistics, and data visualization are used to analyze survey data, conduct experiments, and explore social phenomena. Python’s libraries provide researchers with the tools to analyze large datasets, test hypotheses, and visualize data in meaningful ways. By using statistical techniques and visualizations, social scientists can uncover insights into human behavior, societal trends, and policy impacts.

FAQs

1. Is Python suitable for beginners in statistics and data visualization?

Absolutely! Python has a user-friendly syntax and a vast community that provides resources and support for beginners. With its intuitive libraries, such as NumPy, Pandas, Matplotlib, and Seaborn, Python makes it easier to learn and apply statistical concepts and create compelling visualizations.

2. Can I create interactive data visualizations with Python?

Yes, Python offers libraries like Plotly and Bokeh that specialize in creating interactive data visualizations. These libraries provide features like hover effects, zooming, and panning, allowing users to explore data and gain deeper insights interactively.

3. How can statistics and data visualization benefit businesses?

Statistics and data visualization help businesses make informed decisions based on data insights. By analyzing sales data, customer behavior, and market trends, businesses can optimize their strategies, improve customer satisfaction, and identify new growth opportunities.

4. What are some real-world applications of statistics and data visualization in healthcare?

In healthcare, statistics and data visualization are used for analyzing patient data, monitoring disease outbreaks, evaluating treatment effectiveness, and improving healthcare delivery. These techniques aid in identifying patterns, optimizing healthcare processes, and enhancing patient outcomes.

5. Where can I learn more about statistics and data visualization with Python?

There are various online resources, tutorials, and courses available that can help you learn statistics and data visualization with Python. Websites like DataCamp, Coursera, and YouTube offer comprehensive courses and tutorials that cater to different skill levels. Additionally, Python’s official documentation and online communities like Stack Overflow can provide valuable guidance and support.

Download (PDF)

Download: Practical Web Scraping for Data Science: Best Practices and Examples with Python

Data Visualisation in Python Quick and Easy

Data Visualisation in Python Quick and Easy: Data visualization is an essential aspect of data science and analytics. It involves representing data in graphical form to make it easier to understand and extract insights from. Python is a popular programming language for data visualization, thanks to its versatility and numerous libraries available for data visualization.

In this article, we will explore some quick and easy routes to creating stunning data visualizations in Python.

Data Visualisation in Python Quick and easy
  1. Matplotlib Matplotlib is a popular data visualization library in Python. It provides a wide range of options for creating high-quality charts, graphs, and plots. With Matplotlib, you can create line plots, scatter plots, bar plots, histograms, and more. It is easy to use and is often the go-to library for many data scientists.

To create a line plot in Matplotlib, for instance, you can use the following code:

import matplotlib.pyplot as plt
x = [1, 2, 3, 4, 5]
y = [10, 8, 6, 4, 2]
plt.plot(x, y)
plt.show()
  1. Seaborn Seaborn is another popular data visualization library in Python that is built on top of Matplotlib. It provides a higher-level interface for creating visually appealing and informative statistical graphics. Seaborn includes features such as easy-to-use color palettes, attractive default styles, and built-in themes.

To create a histogram using Seaborn, you can use the following code:

import seaborn as sns
import pandas as pd
data = pd.read_csv('data.csv')
sns.histplot(data=data, x='age', bins=20)
  1. Plotly Plotly is a web-based data visualization library that enables you to create interactive plots and charts. It is easy to use and offers a wide range of customization options, making it ideal for creating stunning visualizations for web applications.

To create an interactive scatter plot using Plotly, you can use the following code:

import plotly.express as px
import pandas as pd
data = pd.read_csv('data.csv')
fig = px.scatter(data, x='height', y='weight', color='gender')
fig.show()
  1. Bokeh Bokeh is a Python data visualization library that provides interactive and responsive visualization tools for modern web browsers. It is particularly useful for creating dynamic visualizations such as interactive dashboards and real-time data streaming applications.

To create a scatter plot with hover tooltips using Bokeh, you can use the following code:

from bokeh.plotting import figure, output_file, show
import pandas as pd
data = pd.read_csv('data.csv')
p = figure(title='Height vs Weight', x_axis_label='Height', y_axis_label='Weight', tooltips=[('Gender', '@gender')])
p.circle(data['height'], data['weight'], color=data['gender'], size=10)
output_file('scatter.html')
show(p)

In conclusion, Python provides several libraries for data visualization, each with its strengths and weaknesses. Choosing the right library for your visualization task will depend on your data, the type of visualization you want to create, and your specific requirements. The four libraries discussed above are just some of the popular ones in the Python data science community, and they can help you create beautiful and informative data visualizations with ease.

Download(PDF)

Beginning Python: From Novice to Professional

Beginning Python: From Novice to Professional: Python is one of the most popular programming languages in the world. It is easy to learn, versatile, and widely used in a variety of industries, from data science to web development. If you are a beginner in Python, this article is for you. In this article, we will take you on a journey from a beginner to an expert in Python.

Getting Started with Python

Python is an interpreted language, which means that you don’t need to compile your code before running it. To get started with Python, you need to install it on your computer. You can download Python from the official website, and the installation process is straightforward. Once you have installed Python, you can start coding.

Beginning Python From Novice to Professional

Python basics

Python syntax is easy to learn, and you can write your first program in a matter of minutes. In Python, you use the print() function to display output on the screen. Here is an example:

print("Hello, World!")

This program will display the message “Hello, World!” on the screen.

Variables in Python

In Python, you use variables to store data. A variable is a container that holds a value. To create a variable in Python, you simply assign a value to it. Here is an example:

name = "John"
age = 25

In this example, we created two variables, name and age, and assigned them the values “John” and 25, respectively.

Data types in Python

Python supports several data types, including strings, integers, floats, and booleans. A string is a sequence of characters, enclosed in quotes. An integer is a whole number, and a float is a decimal number. A boolean is a value that is either true or false. Here are some examples:

name = "John"    # string
age = 25         # integer
height = 1.75    # float
is_student = True   # boolean

Control flow in Python

Control flow is how a program decides which statements to execute. Python has several control flow statements, including if, elif, and else. Here is an example:

age = 25

if age < 18:
    print("You are too young to vote.")
elif age >= 18 and age < 21:
    print("You can vote but not drink.")
else:
    print("You can vote and drink.")

In this example, we used if, elif, and else statements to determine if a person is eligible to vote and drink.

Functions in Python

A function is a block of code that performs a specific task. In Python, you define a function using the def keyword. Here is an example:

def add_numbers(x, y):
    return x + y

result = add_numbers(3, 5)
print(result)

In this example, we defined a function add_numbers that takes two parameters, x and y, and returns their sum. We then called the function with the arguments 3 and 5 and printed the result, which is 8.

Practical Web Scraping for Data Science: Best Practices and Examples with Python

Practical Web Scraping for Data Science: Web scraping, also known as web harvesting or web data extraction, is a technique used to extract data from websites. It involves writing code to parse HTML content and extract information that is relevant to the user. Web scraping is an essential tool for data science, as it allows data scientists to gather information from various online sources quickly and efficiently. In this article, we will discuss practical web scraping techniques for data science using Python.

Before diving into the practical aspects of web scraping, it is essential to understand the legal and ethical implications of this technique. Web scraping can be used for both legal and illegal purposes, and it is essential to use it responsibly. It is crucial to ensure that the data being extracted is not copyrighted, and the website’s terms of service permit web scraping. Additionally, it is important to avoid overloading a website with requests, as this can be seen as a denial-of-service attack.

Practical Web Scraping for Data Science Best Practices and Examples with Python

Now let’s dive into the practical aspects of web scraping for data science. The first step is to identify the website that contains the data you want to extract. In this example, we will use the website “https://www.imdb.com” to extract information about movies. The website contains a list of top-rated movies, and we will extract the movie title, release year, and rating.

To begin, we need to install the following Python libraries: Requests, Beautiful Soup, and Pandas. These libraries are essential for web scraping and data manipulation.

!pip install requests
!pip install beautifulsoup4
!pip install pandas

After installing the necessary libraries, we can begin writing the code to extract the data. The first step is to send a request to the website and retrieve the HTML content.

import requests

url = 'https://www.imdb.com/chart/top'
response = requests.get(url)

Once we have the HTML content, we can use Beautiful Soup to parse the HTML and extract the information we want.

from bs4 import BeautifulSoup

soup = BeautifulSoup(response.content, 'html.parser')
movies = soup.select('td.titleColumn')

The select method is used to select elements that match a specific CSS selector. In this example, we are selecting all the elements with the class “titleColumn.”

We can now loop through the movies list and extract the movie title, release year, and rating.

movie_titles = []
release_years = []
ratings = []

for movie in movies:
    title = movie.find('a').get_text()
    year = movie.find('span', class_='secondaryInfo').get_text()[1:-1]
    rating = movie.find('td', class_='ratingColumn imdbRating').get_text().strip()
    
    movie_titles.append(title)
    release_years.append(year)
    ratings.append(rating)

Finally, we can create a Pandas dataframe to store the extracted data.

import pandas as pd

df = pd.DataFrame({'Title': movie_titles, 'Year': release_years, 'Rating': ratings})
print(df.head())

The output will be a dataframe containing the movie title, release year, and rating.

 Title  Year Rating
0  The Shawshank Redemption  1994    9.2
1             The Godfather  1972    9.1
2    The Godfather: Part II  1974    9.0
3           The Dark Knight  2008    9.0
4              12 Angry Men  1957    8.9

Downlod(PDF)

Using Python Analyze Data to Create Visualizations for BI Systems

In today’s world, data is being generated at an exponential rate. In order to make sense of this data, it is important to have a Business Intelligence (BI) system that can analyze the data and present it in a meaningful way. Python is a powerful programming language that can be used to analyze data and create visualizations for BI systems. In this article, we will discuss how to use Python to analyze data and create visualizations for BI systems.

  1. Data Analysis with Python

Python provides several libraries for data analysis. The most popular of these libraries are Pandas, Numpy, and Matplotlib. Pandas is a library that provides data structures for efficient data analysis. Numpy is a library that provides support for arrays and matrices. Matplotlib is a library that provides support for creating visualizations.

  1. Data Visualization with Python

Visualizations are an important part of BI systems. Python provides several libraries for creating visualizations. The most popular of these libraries are Matplotlib, Seaborn, and Plotly. Matplotlib is a library that provides support for creating basic visualizations. Seaborn is a library that provides support for creating statistical visualizations. Plotly is a library that provides support for creating interactive visualizations.

Using Python Analyze Data to Create Visualizations for BI Systems
  1. Connecting Python with BI Systems

Python can be connected with BI systems using APIs or SDKs. Some popular BI systems that can be connected with Python are Tableau, Power BI, and QlikView. Tableau provides an API that can be used to connect Python with Tableau. Power BI provides an SDK that can be used to connect Python with Power BI. QlikView provides a Python module that can be used to connect Python with QlikView.

  1. Creating Visualizations with Python for BI Systems

Once the data is analyzed and Python is connected with the BI system, visualizations can be created. The visualizations should be meaningful and should help in making decisions. Some examples of visualizations that can be created with Python for BI systems are bar charts, line charts, scatter plots, heat maps, and pie charts.

  1. Conclusion

Python is a powerful programming language that can be used to analyze data and create visualizations for BI systems. It provides several libraries for data analysis and visualization. Python can be connected with BI systems using APIs or SDKs. Visualizations should be meaningful and should help in making decisions. With Python, it is possible to create visualizations that can help in making decisions and improving business performance.

Download(PDF)