Regression models for data science in R: Regression analysis is one of the most widely used statistical techniques in data science, playing a crucial role in understanding the relationship between a dependent variable and one or more independent variables. In this article, we’ll explore regression models in R and discuss how they can be used to analyze and interpret data. What is Regression Analysis? Regression analysis is a statistical method used to study the relationship between a dependent variable and one or more independent variables. It is used to identify the strength and direction of the relationship between these variables and to predict future values of the dependent variable based on the values of the independent variables.

Types of Regression Analysis. There are many types of regression analysis, but the most commonly used ones are linear regression, logistic regression, and polynomial regression.
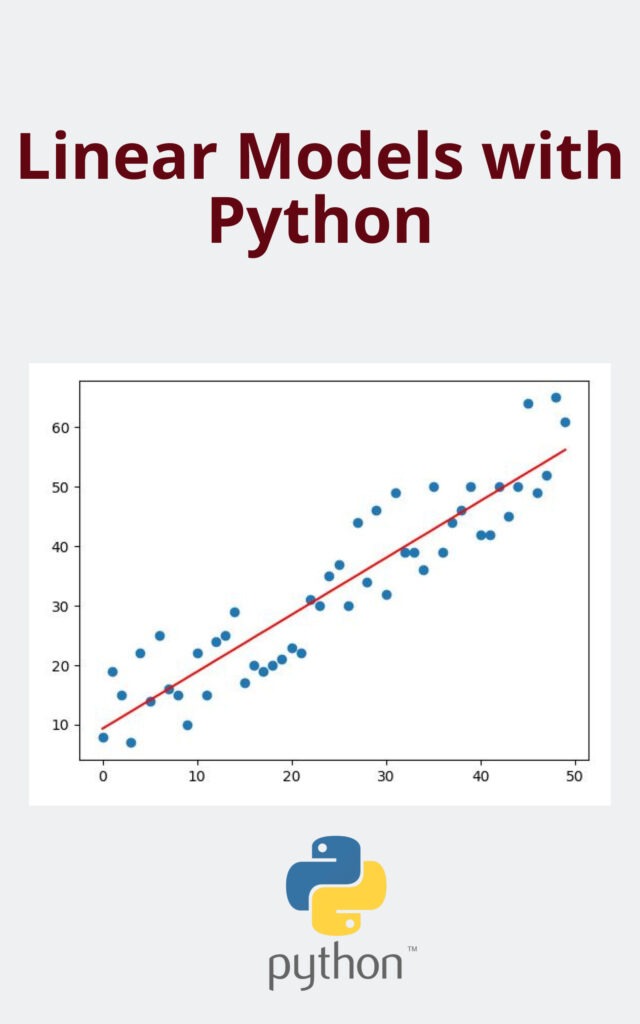
Linear Regression: Linear regression is the simplest type of regression analysis and is used to analyze the relationship between a dependent variable and one independent variable. The goal of linear regression is to find the best-fit line that describes the relationship between the two variables. The line is defined by a slope and an intercept and is given by the equation y = mx + b, where y is the dependent variable, x is the independent variable, m is the slope, and b is the intercept.
Logistic Regression: Logistic regression is used when the dependent variable is categorical. It is used to predict the probability of an event occurring based on the values of the independent variables. The output of logistic regression is a probability value between 0 and 1, which can be converted to a binary decision based on a threshold value.
Polynomial Regression: Polynomial regression is used when the relationship between the dependent and independent variables is not linear. In this case, a polynomial function is used to describe the relationship between the two variables.
Regression Models in R R is a popular language for statistical computing and is widely used in data science. It features numerous built-in functions for performing various types of regression analysis, including linear regression, logistic regression, and polynomial regression.
Linear Regression in R To perform linear regression in R, we use the lm() function. The function takes two arguments, the dependent variable and the independent variable. For example, to perform linear regression on a dataset called “data”, with the dependent variable “y” and the independent variable “x”, we would use the following code:
model <- lm(y ~ x, data = data)
This creates a linear regression model called “model” based on the data in “data”. We can then use the summary() function to display a summary of the model, including the coefficients, intercept, and standard error.
Logistic Regression in R To perform logistic regression in R, we use the glm() function. The function takes two arguments, the dependent variable and the independent variables. For example, to perform logistic regression on a dataset called “data”, with the dependent variable “y” and the independent variables “x1” and “x2”, we would use the following code:
model <- glm(y ~ x1 + x2, data = data, family = binomial)
This creates a logistic regression model called “model” based on the data in “data”. We can then use the summary() function to display a summary of the model, including the coefficients, intercept, and standard error.
Polynomial Regression in R To perform polynomial regression in R, we use the poly() function to generate a polynomial function based on the independent variable. For example, to perform polynomial regression on a dataset called “data”, with the dependent variable “y” and the independent variable “x”, we would use the following code:
polyfit <- lm(y ~ poly(x, 3), data = data)
This creates a polynomial regression model called “polyfit” based on the data.