Introduction, Statistics and Data Analysis in R: In the age of information, data is the driving force behind decision-making in various fields, from business to healthcare, and beyond. Understanding data and drawing meaningful insights from it has become paramount. This article will delve into the world of statistics and data analysis using R, a powerful and versatile programming language.
The Importance of Data Analysis
Data analysis is the process of inspecting, cleaning, transforming, and modeling data to discover useful information, draw conclusions, and support decision-making. In today’s data-driven world, organizations rely on data analysis to gain a competitive edge. It helps in identifying trends, making predictions, and solving complex problems.
Getting Started with R
R is an open-source programming language and environment specifically designed for statistical computing and graphics. It offers a wide range of packages and libraries that make data analysis efficient and accessible. To get started, you’ll need to install R on your computer and perhaps a user-friendly integrated development environment like RStudio.

Basic Data Manipulation
Before diving into analysis, you need to manipulate your data. R provides tools for data cleaning, transformation, and merging datasets. You’ll learn how to handle missing values, filter data, and create new variables.
Exploratory Data Analysis
Exploratory Data Analysis (EDA) is the first step in analyzing data. It involves generating summaries and visualizations to understand the underlying patterns and relationships in your dataset. R makes EDA easy with packages like ggplot2 and dplyr.
Data Visualization
Data visualization is a crucial aspect of data analysis. R offers a plethora of visualization options, from simple scatter plots to complex heatmaps. You’ll explore how to create compelling visualizations to communicate your findings effectively.
Statistical Analysis in R
R is a powerhouse when it comes to statistical analysis. You’ll learn how to perform common statistical tests, such as t-tests and ANOVA, to make inferences about your data. R also supports regression analysis, time series analysis, and more.
Advanced Techniques
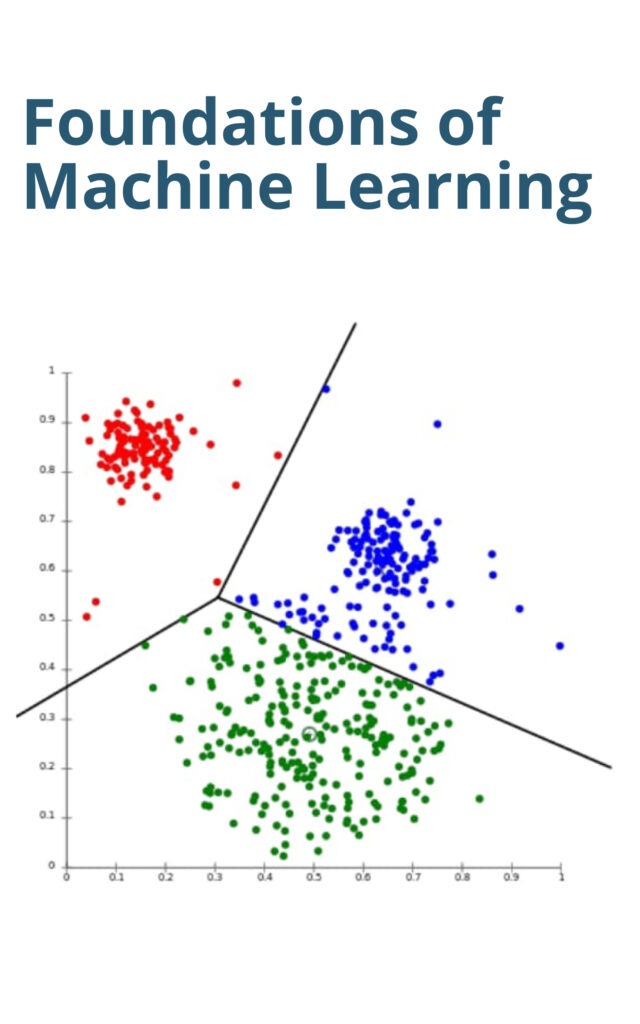
For more complex analyses, R provides advanced techniques and machine learning algorithms. You can delve into topics like clustering, classification, and deep learning using packages like caret and keras.
Real-World Applications
To bring everything together, we’ll showcase real-world applications of R in various domains. From predicting stock prices to diagnosing diseases, R has a wide range of practical uses.
Conclusion
In conclusion, statistics and data analysis in R open doors to a world of possibilities. Whether you’re a data enthusiast, a researcher, or a business professional, mastering R can empower you to make informed decisions based on data-driven insights.
Frequently Asked Questions
- Is R difficult to learn for beginners?
- While R has a learning curve, it’s beginner-friendly with a supportive community and extensive documentation.
- Can I use R for big data analysis?
- Yes, R can handle big data through packages like ‘dplyr’ and ‘data.table.’
- What are some popular R packages for data analysis?
- Popular packages include ‘ggplot2’ for visualization, ‘dplyr’ for data manipulation, and ‘caret’ for machine learning.
- Is R suitable for business analytics?
- Absolutely! R is widely used in business analytics for forecasting, market segmentation, and customer analytics.
- Where can I find datasets to practice with R?
- You can find datasets on websites like Kaggle, UCI Machine Learning Repository, and data.gov.
Download: Regression models for data science in R