If you’re a data scientist or data analyst, 80% of your time you invest in three important steps of data analysis i.e. Data Cleaning, where you transform, rearrange the data to give it a proper shape to make it suitable for data analysis. Next is performing calculations to extract useful information from your dataset and make it ready for the final step: Data Visualization, where you choose suitable graphs or other types of visualization technique to show insight and important information that your data contains. Below we have shared advanced excel formulas for data analysis.
1. SUBSTITUTE

This is a useful trick that is ideal for updating cells in bulks. It’s another one that does exactly what it says and is extremely useful for updating URLs, removing unintentional spaces or spelling errors. In the example above, the formula is replacing the letter ‘t’ with ‘b’.
2. CONCATENATE
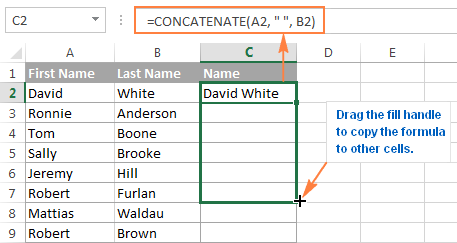
=CONCATENATE is one of the easiest to learn but most powerful formulas when conducting data analysis. Combine text, numbers, dates and more from multiple cells into one. This is an excellent function for creating API endpoints, product SKUs, and Java queries.
3. VLOOKUP
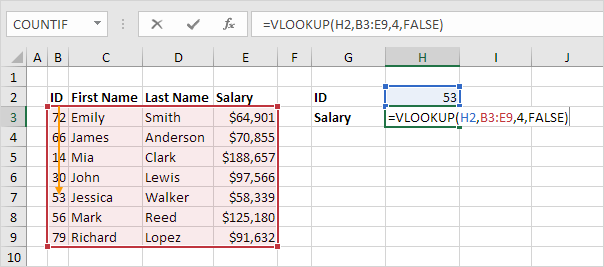
You’ve no doubt come across =VLOOKUP, which will be familiar to anyone who’s used Excel. The formula allows you to lookup data that is arranged in vertical columns. For example, if you have a list of months of the year with the profit made in each month, =VLOOKUP can present the data from the month of your choice.
4. LEN
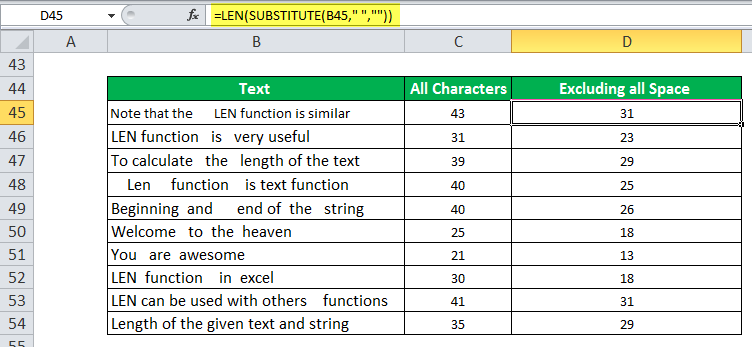
=LEN quickly provides the number of characters in a given cell. As in the example above, you can identify two different kinds of product Stock Keeping Units (SKUs) using the =LEN formula to see how many characters the cell contains. LEN is especially useful when trying to determine the differences between different Unique Identifiers (UIDs), which are often lengthy and not in the right order.
5. SUMIFS
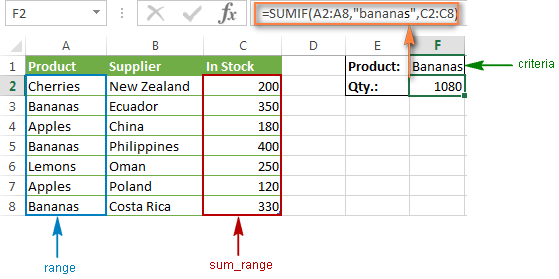
The =SUMIF function is an essential formula in the world of data analytics. The formula adds up the values in cells that meet a selected number. In the above example, the formula is adding up the numbers in cells that are higher than the number 8.
Have you read this: How To Start With Data Science Career?
6. COUNTA
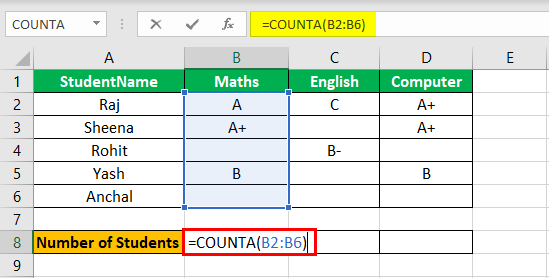
=COUNTA identifies whether a cell is empty or not. In the life of a data analyst, you’re going to run into incomplete data sets daily. COUNTA will allow you to evaluate any gaps the dataset might have without having to reorganize the data.
7. MINIFS/MAXIFS
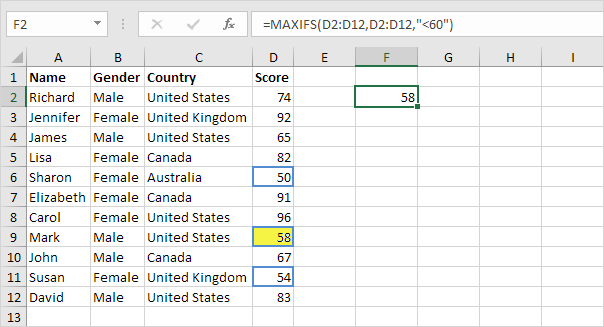
This handy formula identifies which value is the lowest and which is the highest. But it does more than just that, it also sorts values in relation to particular criteria too. For example, you can use it to sort the oldest and youngest ages from a sample of men and women, displaying the values by gender.
8. FIND/SEARCH
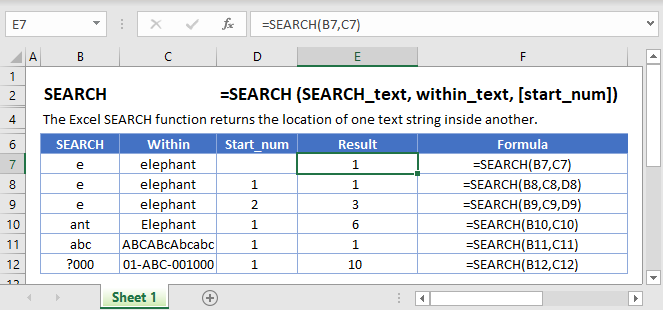
=FIND/=SEARCH are powerful functions for isolating specific text within a data set. Both are listed here because =FIND will return a case-sensitive match, i.e. if you use FIND to query for “Big” you will only return Big=true results. But a =SEARCH for “Big” will match with Big or big, making the query a bit broader. This is particularly useful for looking for anomalies or unique identifiers.
9. IFERROR
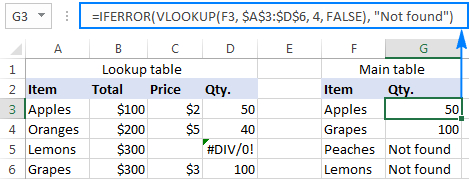
=IFERROR is something that any analyst who actively presents data should take advantage of. .You can use the IFERROR function to trap and handle errors in a formula. IFERROR returns a value you specify if a formula evaluates to an error; otherwise, it returns the result of the formula.
10. DAYS/NETWORKDAYS
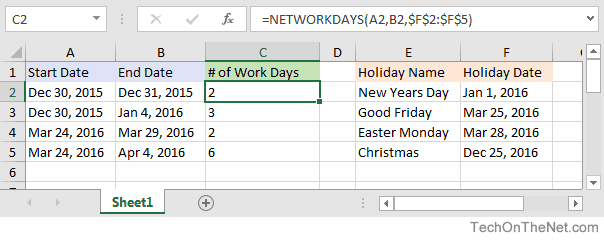
This one is fairly self-explanatory. =DAYS determines the number of days between two calendar dates, and is commonly used to determine product life cycles or contract periods. =NETWORKDAYS is its more useful counterpart and is used to calculate the number of working days between two dates. You could say this formula lives for the weekend.
Now we are on Patreon: https://www.patreon.com/pyoflife
