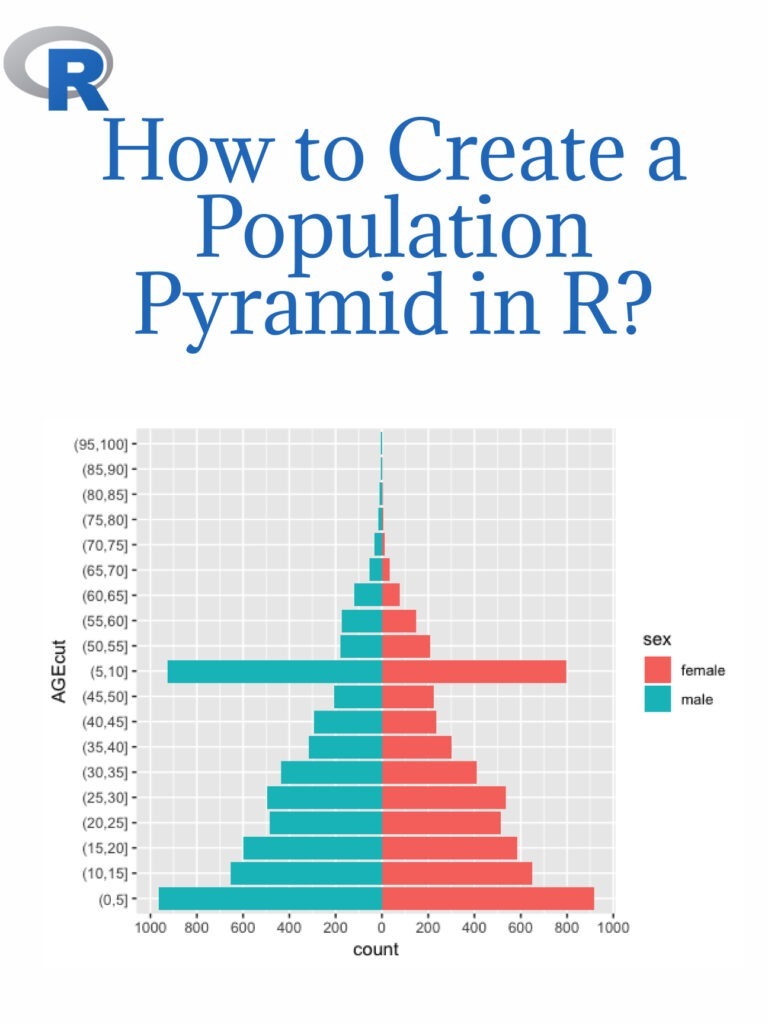
An age-sex pyramid is also known as a population pyramid. Using it, we can visualize the distribution of a population by age group and gender. In general, it resembles a pyramid. Females are represented on the right of the population pyramid, while males are typically depicted on the left. Based on the number or percentage of men and women in a particular population, this data visualization method can be used to visualize that population’s age. Creating a population pyramid in R is a common data analysis and visualization task. Here are the steps to create a population pyramid in R:
Step 1: Install and load necessary packages Before starting to create a population pyramid, we need to install and load the ggplot2 and dplyr packages. These packages are used for data visualization and data manipulation, respectively.
install.packages("ggplot2")
install.packages("dplyr")

library(ggplot2)
library(dplyr)
Step 2: Load the Data To create a population pyramid, we need data on the age and sex distribution of the population. We can use the built-in “midwest” dataset from ggplot2 package as an example.
data(midwest)
Step 3: Data Wrangling Next, we need to prepare the data for the population pyramid visualization. We will use the dplyr package to manipulate the data.
midwest <- midwest %>%
  select(county, state, Poptotal, popdensity, percwhite, percblack, percamericanindian, percasian, perchispanic, percother, medianage, medianhousevalue, medianincome, region, division) %>%
  filter(!is.na(Poptotal), !is.na(medianage)) %>%
  mutate_at(vars(percwhite:percother), ~replace_na(., 0))
Step 4: Create the Population Pyramid Now, we can create the population pyramid using the ggplot2 package.
ggplot(midwest, aes(x = medianage, y = Poptotal, fill = factor(ifelse(medianage < 37.5, "Male", "Female")))) +
  geom_bar(stat = "identity", position = "identity") +
  scale_fill_manual(values = c("#619CFF", "#FF6161")) +
  labs(title = "Population Pyramid", x = "Median Age", y = "Population", fill = "") +
  coord_flip()
This will create a population pyramid in R, showing the age and sex distribution of the population.
The above example is just a sample, and you can use your own data to create the population pyramid in R.
