Statistics is a crucial field that allows us to make sense of data and draw meaningful conclusions. In today’s data-driven world, statistical analysis has become an essential skill across various domains. One popular tool used by statisticians and data analysts is R, a powerful programming language and environment for statistical computing and graphics. This article will serve as an introductory guide to statistics using R, exploring its capabilities and providing practical examples.
Why Use R for Introductory Statistics?
R offers several advantages for conducting introductory statistics. Firstly, it is an open-source language with a vast community of users and developers, which means you can access a wide range of resources, packages, and support. Additionally, R provides a flexible and extensible environment for data manipulation, visualization, and statistical modeling. Its syntax is intuitive and allows for efficient coding, making it an excellent choice for beginners and experienced statisticians alike.
Before we dive into the world of statistics with R, let’s first set up our environment. Start by downloading and installing R from the official R website (https://www.r-project.org/). Once R is installed, it is recommended to use RStudio, an integrated development environment (IDE) designed explicitly for R. RStudio provides a user-friendly interface and simplifies the process of writing, executing, and managing R code.
Basic Data Manipulation in R
In any statistical analysis, data manipulation is often the first step. R offers powerful tools for importing, cleaning, and transforming data. You can read data from various file formats such as CSV, Excel, or databases. R’s data manipulation packages, such as dplyr and tidyr, provide functions for filtering, sorting, aggregating, and reshaping data. These tools enable you to prepare your data for further analysis efficiently.
Descriptive Statistics with R
Descriptive statistics allow us to summarize and visualize the main characteristics of a dataset. R provides a rich set of functions and packages for calculating descriptive statistics. With R, you can compute measures such as mean, median, standard deviation, and percentiles. Furthermore, R’s visualization packages like ggplot2 enable the creation of insightful charts and graphs to visually represent the data distribution.
Probability Distributions in R
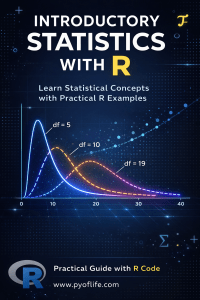
Probability distributions play a fundamental role in statistics, and R offers comprehensive support for working with them. Whether you need to generate random numbers from specific distributions or calculate probabilities, R has you covered. The stats package in R includes functions for common probability distributions like the normal distribution, the binomial distribution, and many more. You can utilize these functions to analyze and simulate data based on different probability distributions.
Hypothesis Testing in R
Hypothesis testing is a statistical method used to make inferences about a population based on sample data. R provides a wide range of functions and packages to perform hypothesis testing. You can conduct tests for means, proportions, variances, and more. The output of these tests includes p-values, confidence intervals, and test statistics, allowing you to assess the significance of your findings.
Regression Analysis in R
Regression analysis is a powerful statistical technique used to model and understand the relationship between variables. R offers robust tools for performing regression analysis, including linear regression, logistic regression, and more advanced techniques like multivariate regression. These methods allow you to analyze and interpret the effects of independent variables on a dependent variable, making predictions and drawing conclusions from your data.
Conclusion
In conclusion, learning introductory statistics with R opens up a world of possibilities for data analysis. R provides a comprehensive and versatile environment for statistical analysis, from basic data manipulation to advanced modeling techniques. By mastering R, you gain a valuable skill set that empowers you to explore and draw insights from data effectively.
FAQs
1. Can I use R for other types of data analysis besides statistics? Absolutely! R is widely used for various data analysis tasks, including machine learning, data visualization, and data mining.
2. Are there any prerequisites to learning statistics with R? While having a basic understanding of statistics is helpful, R itself does not require any prerequisites. It is accessible to beginners and provides ample resources for learning.
3. Can I create interactive visualizations with R? Yes, R offers packages like Shiny and Plotly that allows you to create interactive and dynamic visualizations for web applications or presentations.
4. Is R suitable for big data analysis? R has some limitations when it comes to big data analysis due to its in-memory nature. However, there are packages like dplyr and data.table that optimize performance for large datasets.
5. Where can I find additional resources to learn statistics with R? There are several online platforms, tutorials, and books available that provide comprehensive learning materials for statistics with R. Some recommended resources include Coursera, DataCamp, and the official R documentation.
Data Analysis and Prediction Algorithms with R: In today’s digital age, data is being generated at an unprecedented rate. From social media interactions to online purchases, every action we take leaves behind a trail of data. However, raw data alone is of little use without the right tools and techniques to analyze and derive meaningful insights from it. This is where data science comes into play. In this article, we will explore the fundamentals of data science, focusing on data analysis and prediction algorithms using the programming language R.
1. What is Data Science?
Data science is an interdisciplinary field that combines various techniques, tools, and methodologies to extract valuable insights and knowledge from data. It encompasses several domains, including statistics, computer science, and domain expertise. Data scientists use their skills to collect, process, analyze, and interpret large volumes of data to uncover patterns, trends, and relationships.
Introduction to Data Science, Data Analysis, and Prediction Algorithms with R
Data analysis is a crucial step in the data science workflow. It involves examining, cleaning, transforming, and modeling data to discover meaningful information. Through data analysis, organizations can make data-driven decisions, identify opportunities, optimize processes, and solve complex problems. It plays a pivotal role in numerous industries, such as finance, healthcare, marketing, and technology.
3. Introduction to R
R is a powerful programming language and open-source software environment specifically designed for statistical computing and graphics. It provides a wide range of libraries and packages that facilitate data manipulation, visualization, and analysis. R has gained popularity among data scientists due to its flexibility, extensive community support, and rich ecosystem of tools.
4. Exploratory Data Analysis
Exploratory Data Analysis (EDA) is the initial phase of data analysis. It involves examining the data’s characteristics, summarizing its main features, and visualizing its patterns. R offers various functions and packages, such as ggplot2 and dplyr, that enable data scientists to explore datasets, detect outliers, handle missing values, and gain insights into the data’s distribution.
5. Data Visualization with R
Effective data visualization is essential for conveying information and findings in a concise and understandable manner. R provides numerous libraries, including ggplot2 and plotly, that offer extensive options for creating compelling visualizations. With R’s versatile graphing capabilities, data scientists can create bar charts, scatter plots, line graphs, heatmaps, and more to effectively communicate their insights.
6. Statistical Analysis with R
Statistical analysis is an integral part of data science. R provides a comprehensive suite of statistical functions and packages that allow data scientists to perform various statistical tests, calculate probabilities, and make inferences. Whether it’s hypothesis testing, regression analysis, or ANOVA, R offers the necessary tools to conduct robust statistical analyses.
7. Predictive Modeling with R
Predictive modeling involves building models that can make predictions or forecasts based on historical data. R offers an extensive collection of machine learning algorithms and libraries, such as caret and randomForest, which enable data scientists to develop predictive models. From linear regression to decision trees and neural networks, R provides a wide range of tools to build accurate and reliable predictive models.
8. Machine Learning Algorithms in R
Machine learning is a subfield of artificial intelligence that focuses on developing algorithms and models that can learn from data and make predictions or take actions without being explicitly programmed. R encompasses a vast array of machine learning algorithms, including support vector machines, k-nearest neighbors, naive Bayes, and deep learning models. These algorithms enable data scientists to tackle complex problems and uncover hidden insights.
9. Evaluating Model Performance
Once a predictive model is built, it is crucial to assess its performance. R offers various metrics and techniques, such as cross-validation, confusion matrices, and ROC curves, to evaluate the accuracy, precision, recall, and other performance measures of a model. Evaluating model performance helps data scientists identify areas for improvement and ensure the model’s reliability and generalizability.
10. Data Science Applications
Data science finds applications across diverse industries and domains. From predicting customer churn and fraud detection to image recognition and recommender systems, data science techniques can be leveraged to solve complex problems and drive business growth. Companies and organizations worldwide are increasingly recognizing the value of data science in gaining a competitive edge and making data-driven decisions.
11. Challenges and Future Directions
While data science offers immense opportunities, it also comes with its challenges. Some of the common hurdles include data quality and cleaning, privacy concerns, and interpreting complex models. As technology continues to advance, data scientists will face new challenges and opportunities, such as handling big data, incorporating explainable AI, and addressing ethical considerations. The field of data science will continue to evolve, opening up exciting possibilities for innovation and discovery.
FAQs
1. Is knowledge of programming essential for data science? Yes, having programming skills is beneficial for data scientists, especially in languages like R, Python, or SQL.
2. Can data science be applied to non-technical fields? Absolutely! Data science has applications in various domains, including healthcare, finance, marketing, social sciences, and more.
3. What are some popular machine learning algorithms in R? R offers a wide range of machine learning algorithms, including decision trees, random forests, support vector machines (SVM), and neural networks.
4. How can data science help businesses gain a competitive edge? Data science enables businesses to leverage their data to identify patterns, make predictions, optimize processes, and make data-driven decisions.
5. What are the future trends in data science? Some emerging trends in data science include explainable AI, automated machine learning (AutoML), and ethical considerations in AI and data usage.
Numerical Analysis Using R: In the world of mathematics and scientific research, understanding and solving complex mathematical equations is often essential. Ordinary Differential Equations (ODEs) and Partial Differential Equations (PDEs) are two types of equations that frequently arise in various fields such as physics, engineering, and economics. While some ODEs and PDEs have analytical solutions, many of them require numerical methods for practical implementation.
Introduction to Numerical Analysis
Numerical analysis is a branch of mathematics that focuses on developing algorithms and computational techniques to approximate solutions to mathematical problems. It plays a crucial role in scientific research and engineering applications, providing valuable insights and predictions where exact solutions are difficult or impossible to obtain.
Numerical Analysis Using R Solutions to ODEs and PDEs
ODEs are differential equations that involve derivatives of a single dependent variable with respect to one independent variable. They describe various dynamic processes, such as population growth, chemical reactions, and motion. ODEs are typically written in the form of F(dy/dx, y, x) = 0, where F represents a function.
Importance in Various Fields
ODEs find applications in diverse scientific disciplines. For example, in physics, they describe the behavior of physical systems, including celestial mechanics, fluid dynamics, and quantum mechanics. In engineering, ODEs are used to model and analyze control systems, electrical circuits, and structural mechanics.
Solving ODEs Numerically
There are several numerical methods available to solve ODEs, each with its own strengths and limitations. Here are three commonly used methods:
Euler’s Method
Euler’s method is a simple numerical method for solving ODEs. It approximates the solution by iteratively stepping forward from an initial condition, using the derivative information at each step. While Euler’s method is straightforward to implement, it can introduce significant errors, especially for complex problems or large step sizes.
Runge-Kutta Methods
Runge-Kutta methods are a family of numerical techniques that provide more accurate approximations of ODE solutions. They use multiple evaluations of the derivative at various points within each step, resulting in higher-order approximations. The fourth-order Runge-Kutta method (RK4) is one of the most widely used in practice due to its balance between accuracy and computational efficiency.
Finite Difference Methods
Finite difference methods discretize the ODE domain into a set of grid points, approximating the derivatives using finite differences between adjacent points. These methods convert differential equations into a system of algebraic equations that can be solved using matrix techniques. Finite difference methods are versatile and can handle a wide range of ODE problems.
Introduction to Partial Differential Equations (PDEs)
Definition and Examples
PDEs involve partial derivatives and describe phenomena with multiple independent variables, such as heat conduction, wave propagation, and fluid flow. They are widely used in physics, engineering, and finance to model complex systems that exhibit spatial and temporal variations.
Applications in Science and Engineering
PDEs have numerous applications across various scientific and engineering fields. In physics, they describe the behavior of electromagnetic fields, quantum mechanics, and general relativity. In engineering, PDEs govern the dynamics of structures, fluid flow in pipes, and heat transfer in materials.
Solving PDEs Numerically
Solving PDEs numerically is more challenging than solving ODEs due to their additional complexity and higher dimensionality. However, several numerical methods have been developed to tackle these problems effectively. Here are three commonly used methods:
Finite Difference Methods
Finite difference methods discretize the PDE domain similarly to ODEs but with additional dimensions. They approximate the spatial derivatives using finite differences, resulting in a system of algebraic equations. These methods are suitable for problems with simple geometries and regular grids.
Finite Element Methods
Finite element methods divide the PDE domain into smaller elements and express the solution as a combination of basis functions over these elements. By applying variational principles, the PDE problem is converted into a set of linear equations. Finite element methods offer greater flexibility in handling complex geometries and irregular grids.
Spectral Methods
Spectral methods represent the solution as a sum of basis functions, often chosen as trigonometric or polynomial functions. These methods provide high accuracy by exploiting the smoothness of the solution. Spectral methods are particularly effective for problems with smooth or periodic solutions.
Implementing Numerical Analysis in R
R is a powerful and popular programming language for statistical computing and data analysis. It provides a wide range of packages and libraries that make it well-suited for numerical analysis tasks. Here’s an overview of R’s capabilities and some essential packages for numerical analysis:
Overview of R and its Numerical Capabilities
R is an open-source language with a rich ecosystem of packages that extend its functionality. It has a comprehensive set of built-in functions for mathematical computations, including linear algebra, numerical optimization, and numerical integration. R’s flexibility and extensibility make it an excellent choice for numerical analysis tasks.
Packages for Numerical Analysis in R
R offers several packages specifically designed for numerical analysis. Some popular packages include:
deSolve: Provides functions for solving ordinary and partial differential equations.
FME: Implements finite difference methods for solving differential equations.
FEniCS: Enables finite element methods for PDE problems.
chebfun: Supports spectral methods for solving differential equations.
rootSolve: Offers root-finding algorithms and systems of nonlinear equations solvers.
By leveraging these packages, researchers and practitioners can efficiently implement numerical methods for solving ODEs and PDEs in R.
Solving ODEs Using R
R provides various functions and packages for solving ODEs numerically. Let’s explore two commonly used methods:
Implementing Euler’s Method in R
Euler’s method can be implemented in R using a simple iterative approach. Here’s an example code snippet:
# Define the ODE function
ode_function <- function(t, y) {
  # Define the ODE equation
  dy_dt <- -0.2 * y
  return(list(dy_dt))
}

# Implement Euler's method
eulers_method <- function(ode_function, initial_condition, t_start, t_end, step_size) {
  t <- seq(t_start, t_end, by = step_size)
  y <- numeric(length(t))
  y[1] <- initial_condition

  for (i in 2:length(t)) {
    dy_dt <- ode_function(t[i - 1], y[i - 1])
    y[i] <- y[i - 1] + step_size * dy_dt
  }

  return(data.frame(t = t, y = y))
}

# Solve the ODE using Euler's method
solution <- eulers_method(ode_function, initial_condition = 1, t_start = 0, t_end = 10, step_size = 0.1)

# Plot the solution
plot(solution$t, solution$y, type = "l", xlab = "t", ylab = "y")
In this example, we define the ODE function, ode_function, which represents the derivative of y with respect to t. The eulers_method the function implements Euler’s method, taking the ODE function, initial condition, time range, and step size as inputs. It returns a data frame with the numerical solution. Finally, we can plot the solution using the plot function.
Implementing Runge-Kutta Methods in R
R provides several packages that include Runge-Kutta methods for solving ODEs, such as the deSolve package. Here’s an example of using the deSolve package to solve an ODE:
# Install and load the deSolve package
install.packages("deSolve")
library(deSolve)

# Define the ODE function
ode_function <- function(t, y, params) {
  # Define the ODE equation
  dy_dt <- -0.2 * y
  return(list(dy_dt))
}

# Set the initial condition and time range
initial_condition <- 1
t_range <- c(0, 10)

# Solve the ODE using the lsoda solver from deSolve
solution <- lsoda(y = initial_condition, times = t_range, func = ode_function)

# Plot the solution
plot(solution, xlab = "t", ylab = "y")
In this example, we install and load the deSolve package. We then define the ODE function, ode_function which represents the derivative y with respect to t and takes additional parameters if needed. The lsoda function solves the ODE using the LSODA solver provided by the deSolve package. Finally, we plot the solution using the plot function.
Solving PDEs Using R
Solving PDEs numerically in R can be accomplished using various packages that provide the finite difference, finite element, or spectral methods. Let’s explore a couple of examples:
Implementing Finite Difference Methods in R
R offers the FME package, which provides tools for solving differential equations using finite difference methods. Here’s an example of solving a simple PDE using finite differences:
# Install and load the FME package
install.packages("FME")
library(FME)

# Define the PDE function
pde_function <- function(x, t, u, du_dx, du_dt) {
  # Define the PDE equation
  d2u_dx2 <- FME::fdiff2d(du_dx, x)
  du_dt[] <- d2u_dx2[]
  return(du_dt)
}

# Set the spatial and temporal discretization
x <- seq(0, 1, length.out = 101)
t <- seq(0, 1, length.out = 101)

# Set the initial condition
u0 <- sin(pi * x)

# Solve the PDE using finite differences
solution <- FME::fdm2d(x = x, t = t, u0 = u0, func = pde_function)

# Plot the solution
image(solution$x, solution$t, solution$u, xlab = "x", ylab = "t", col = heat.colors(100))
In this example, we install and load the FME package. We define the PDE function, pde_function, which represents the PDE equation and takes spatial and temporal derivatives as input. The fdm2d function solves the PDE using finite difference methods, given the spatial and temporal discretizations, initial condition, and PDE function. Finally, we visualize the solution using the image function.
Implementing Finite Element Methods in R
R provides the FEniCS package, which enables finite element methods for solving PDEs. Here’s an example of solving a 1D heat equation using finite elements:
# Install and load the FEniCS package
install.packages("FEniCS")
library(FEniCS)

# Define the domain and mesh
mesh <- UnitIntervalMesh(100)

# Define the function space
V <- FunctionSpace(mesh, "CG", 1)

# Define the trial and test functions
u <- TrialFunction(V)
v <- TestFunction(V)

# Define the PDE equation
f <- Expression("exp(-pow(x[0] - 0.5, 2) / 0.1)")
a <- dot(grad(u), grad(v)) * dx
L <- f * v * dx

# Define the boundary condition
u0 <- Expression("0.5*sin(pi*x[0])")
bc <- DirichletBC(V, u0, "on_boundary")

# Solve the PDE using finite element methods
u <- Function(V)
solve(a == L, u, bc)

# Plot the solution
plot(u)
In this example, we install and load the FEniCS package. We define the domain and mesh using the UnitIntervalMesh function. The function space, trial function (u), and test function (v) are defined using FunctionSpace and TrialFunction/TestFunction, respectively. The PDE equation is represented by the forms a and L. We also define the boundary condition (bc). The solve function solves the PDE equation, and the resulting solution is plotted using the plot function.
Comparison of Numerical Methods
When choosing a numerical method for solving ODEs or PDEs, several factors need to be considered, including accuracy, efficiency, stability, and ease of implementation. Euler’s method is the simplest but least accurate method for ODEs. Runge-Kutta methods offer higher accuracy but require more computational resources. Finite difference methods are straightforward to implement and suitable for problems with simple geometries. Finite element methods provide greater flexibility for complex geometries but may be computationally more demanding. Spectral methods yield high accuracy but may be more challenging to implement for certain problems.
FAQs
Q1: Can I solve ODEs or PDEs analytically instead of numerically?
Yes, some ODEs and PDEs have analytical solutions that can be obtained using mathematical techniques. However, analytical solutions are often limited to simple or idealized problems. Numerical methods are necessary for solving complex or real-world problems.
Q2: Are there other programming languages suitable for numerical analysis?
Yes, there are several programming languages commonly used for numerical analysis, such as Python, MATLAB, and Julia. Each language has its own strengths and a wide range of libraries for numerical computations.
Q3: Can I visualize the results of numerical solutions in R?
Yes, R provides various packages for data visualization, such as ggplot2, plotly, and lattice. These packages can be used to plot and visualize the results of numerical solutions.
Q4: How can I choose the appropriate numerical method for my problem?
The choice of a numerical method depends on the specific problem, including its nature, complexity, and available computational resources. It is recommended to consider factors such as accuracy requirements, problem dimensionality, geometry, and available software tools when selecting a suitable method.
Q5: Where can I learn more about numerical analysis and its applications?
There are numerous resources available for learning about numerical analysis, including online courses, textbooks, and academic papers. Some recommended resources include “Numerical Recipes” by Press et al., “Numerical Analysis” by Burden and Faires, and online courses from platforms like Coursera, edX, and MIT OpenCourseWare.
Modern Statistics is vital in analyzing and interpreting data in various domains. With the advent of technology, a computer-based approach has become increasingly popular in the field of statistics. In this article, we will explore the significance of modern statistics and its seamless integration with the Python programming language. We will delve into the essential statistical concepts, techniques, and tools while highlighting real-world applications and future trends. So, let’s embark on this journey to discover the power of modern statistics with Python.
Introduction to Modern Statistics
Modern Statistics is an interdisciplinary field that involves the collection, analysis, interpretation, presentation, and organization of data. It provides a framework for making informed decisions and drawing meaningful insights from complex datasets. In today’s data-driven world, the ability to extract valuable information from data is crucial for businesses, researchers, and policymakers.
Statistics plays a pivotal role in data analysis by providing a set of methods and techniques to analyze and interpret data. It helps in summarizing and describing data, identifying patterns and relationships, making predictions, and drawing conclusions. Statistics enables us to make informed decisions based on evidence rather than intuition or guesswork.
Advantages of a Computer-Based Approach in Statistics
A computer-based approach to statistics offers several advantages over traditional manual methods. It allows for efficient data handling, automated calculations, and the ability to work with large datasets. Additionally, computer-based approaches provide visualizations that aid in understanding complex relationships within the data. The use of statistical software, such as Python, enhances reproducibility, scalability, and collaboration in statistical analysis.
Overview of Python for Statistical Analysis
Python is a versatile and widely-used programming language that has gained popularity in the field of data analysis and statistics. Its simplicity, readability, and extensive ecosystem of libraries make it an ideal choice for statistical analysis. Python provides powerful tools for data manipulation, visualization, statistical modeling, and machine learning, making it a comprehensive platform for modern statistics.
Basic Statistical Concepts and Techniques
Before diving into the practical aspects of statistical analysis with Python, let’s establish a foundation by understanding some fundamental statistical concepts and techniques. These concepts include measures of central tendency (mean, median, and mode), measures of dispersion (variance and standard deviation), probability distributions, and hypothesis testing. Familiarity with these concepts is essential for conducting effective statistical analysis.
Mean, Median, and Mode
The mean represents the average value of a dataset, the median is the middle value, and the mode is the most frequently occurring value. These measures provide insights into the central tendency of data.
Variance and Standard Deviation
Variance measures the spread of data around the mean, while standard deviation is the square root of the variance. These measures quantify the dispersion or variability within a dataset.
Probability Distributions
Probability distributions describe the likelihood of different outcomes in a dataset. Common distributions include the normal distribution, binomial distribution, and Poisson distribution.
Hypothesis Testing
Hypothesis testing is a statistical method used to make inferences about a population based on sample data. It involves formulating null and alternative hypotheses, conducting statistical tests, and interpreting the results.
Exploratory Data Analysis with Python
Exploratory Data Analysis (EDA) is an essential step in the statistical analysis process. It involves examining and visualizing the data to gain insights and identify patterns, anomalies, and relationships. Python provides numerous libraries, such as Matplotlib and Seaborn, that facilitate data visualization and descriptive statistics.
Data Visualization
Data visualization is a powerful tool for understanding and communicating data. Python libraries like Matplotlib and Seaborn offer a wide range of plots, such as scatter plots, histograms, and box plots, to visualize data distributions, correlations, and trends.
Descriptive Statistics
Descriptive statistics summarize and describe the main characteristics of a dataset. Measures like the mean, median, standard deviation, and correlation coefficients provide valuable insights into the data’s central tendency, dispersion, and relationships.
Correlation Analysis
Correlation analysis measures the strength and direction of the relationship between two or more variables. Python enables the calculation of correlation coefficients and the creation of correlation matrices to identify patterns and dependencies.
Statistical Modeling and Inference
Statistical modeling involves constructing mathematical models to represent relationships between variables and making predictions or inferences based on these models. Python offers powerful libraries, such as StatsModels and scikit-learn, to fit various statistical models and conduct inference.
Linear Regression
Linear regression is a widely-used statistical technique for modeling the relationship between a dependent variable and one or more independent variables. Python’s StatsModels library provides comprehensive functionality for fitting linear regression models and analyzing their statistical significance.
Logistic Regression
Logistic regression is a statistical technique used to model the probability of a binary outcome based on one or more independent variables. It is commonly used in classification problems. Python’s scikit-learn library offers efficient implementations of logistic regression models.
Time Series Analysis
Time series analysis deals with analyzing and forecasting data that is collected over time. Python provides libraries like StatsModels and Pandas for time series modeling, enabling the identification of trends, seasonality, and forecasting.
Machine Learning Techniques in Statistics
Machine learning techniques are increasingly being incorporated into statistical analysis workflows. Python’s scikit-learn library offers a wide range of machine-learning algorithms for classification, regression, clustering, and dimensionality reduction.
Classification Algorithms
Classification algorithms aim to predict categorical or discrete outcomes based on input features. Algorithms such as decision trees, random forests, and support vector machines are widely used in classification tasks.
Clustering Algorithms
Clustering algorithms group similar data points based on their similarity or distance measures. Python provides algorithms like k-means clustering and hierarchical clustering for unsupervised learning.
Decision Trees
Decision trees are hierarchical models that use a tree-like structure to make decisions based on input features. They are interpretable and can handle both categorical and numerical data.
Random Forests
Random forests are an ensemble learning method that combines multiple decision trees to improve prediction accuracy. They are robust against overfitting and handle high-dimensional datasets well.
Data Preprocessing and Cleaning
Data preprocessing and cleaning are crucial steps in statistical analysis to ensure the accuracy and reliability of results. Python provides tools and libraries for handling missing data, outliers, and feature scaling.
Missing Data Handling
Missing data can significantly impact statistical analysis. Python’s Pandas library offers methods for detecting and imputing missing values, ensuring complete and reliable datasets.
Outlier Detection and Treatment
Outliers are data points that deviate significantly from the rest of the dataset. Python provides various techniques, such as z-score analysis and box plots, to detect and handle outliers appropriately.
Feature Scaling and Normalization
Feature scaling and normalization ensure that variables are on similar scales, preventing certain features from dominating the analysis. Python provides functions and transformers for scaling and normalizing data.
Advanced Statistical Techniques with Python
Python supports advanced statistical techniques that go beyond the basics. These techniques include ANOVA and experimental design, factor analysis, survival analysis, and Bayesian statistics.
ANOVA and Experimental Design
Analysis of Variance (ANOVA) is a statistical technique used to compare means between two or more groups. Python’s SciPy library offers functions for performing ANOVA and designing experiments.
Factor Analysis
Factor analysis is a statistical technique used to identify underlying factors or latent variables in a dataset. Python’s FactorAnalyzer library provides functions for conducting factor analysis.
Survival Analysis
Survival analysis deals with time-to-event data, such as survival times or failure times. Python’s lifelines library offers tools for survival modeling and estimating survival probabilities.
Bayesian Statistics
Bayesian statistics is an approach to statistical inference that uses probability theory to update beliefs about unknown quantities. Python’s PyMC3 library provides a flexible framework for Bayesian modeling and analysis.
Integration of Statistical Analysis with Python Libraries
Python libraries such as NumPy, Pandas, Matplotlib, Seaborn, StatsModels, and scikit-learn facilitate statistical analysis by providing efficient and user-friendly tools.
NumPy for Numerical Computing
NumPy is a fundamental library for numerical computing in Python. It provides efficient data structures and functions for performing mathematical operations on arrays and matrices.
Pandas for Data Manipulation
Pandas is a powerful library for data manipulation and analysis. It provides data structures like DataFrames that enable easy handling of structured data and offers functions for data cleaning, transformation, and merging.
Matplotlib and Seaborn for Data Visualization
Matplotlib and Seaborn are widely-used libraries for creating visualizations in Python. They offer a variety of plots and customization options to present data effectively and aesthetically.
SciPy for Scientific Computing
SciPy is a library that extends the functionality of NumPy and provides additional scientific computing tools. It includes functions for optimization, interpolation, integration, and more.
StatsModels and scikit-learn for Statistical Modeling
StatsModels and scikit-learn are powerful libraries for statistical modeling and machine learning, respectively. They offer a wide range of models, algorithms, and evaluation metrics for comprehensive analysis.
Challenges and Limitations of Modern Statistics with Python
While Python and modern statistics offer numerous advantages, there are also challenges and limitations to consider. Some challenges include data quality issues, algorithm selection, and interpretability of complex models. Additionally, the scalability of certain algorithms may pose limitations for large-scale datasets.
Real-world Applications of Modern Statistics with Python
Modern statistics with Python finds applications in various fields, including finance, healthcare, marketing, social sciences, and more. It is used for fraud detection, risk analysis, customer segmentation, predictive modeling, and evidence-based decision-making.
Future Trends in Modern Statistics
As technology advances, modern statistics will continue to evolve. Future trends may include the integration of artificial intelligence and machine learning algorithms, advancements in deep learning, and the development of more efficient and scalable statistical methods.
Conclusion
Modern statistics with a computer-based approach using Python offers powerful tools and techniques for data analysis and interpretation. It enables researchers, analysts, and businesses to extract valuable insights from complex datasets. By leveraging the capabilities of Python libraries and embracing the fundamentals of statistical analysis, one can harness the power of modern statistics to make informed decisions and drive meaningful outcomes.
FAQs
1. Is Python the only language used for modern statistical analysis?
No, there are other programming languages like R, SAS, and Julia that are also popular for statistical analysis. However, Python’s versatility, ease of use, and extensive libraries make it a preferred choice for many statisticians and data analysts.
2. Do I need a strong programming background to perform statistical analysis with Python?
Having a basic understanding of programming concepts will certainly be beneficial. However, Python’s simplicity and extensive documentation make it accessible to individuals with varying levels of programming experience.
3. Can I perform machine learning tasks using Python for statistical analysis?
Absolutely! Python’s ecosystem of libraries, such as scikit-learn, provides powerful machine-learning algorithms for classification, regression, clustering, and more. These techniques can be seamlessly integrated into statistical analysis workflows.
4. How do I ensure the accuracy and reliability of my statistical analysis in Python?
Data preprocessing, cleaning, and validation are essential steps to ensure the accuracy and reliability of your analysis. It’s important to handle missing data appropriately, detect and treat outliers, and validate your results through cross-validation or other statistical techniques.
5. Where can I find additional resources to learn modern statistics with Python?
There are several online resources, tutorials, and books available to learn modern statistics with Python. Websites like DataCamp, Coursera, and Udemy offer courses specifically focused on statistical analysis using Python. Additionally, Python’s official documentation and community forums can provide valuable insights and guidance.
Nonlinear time series analysis is a powerful tool for uncovering hidden patterns and relationships within time-dependent data. Unlike linear time series analysis, which assumes a linear relationship between variables, nonlinear analysis techniques capture the intricate dynamics and chaotic behavior present in many real-world systems. In this article, we will explore the fundamentals of nonlinear time series analysis and demonstrate how to implement these techniques using the R programming language.
Introduction to Nonlinear Time Series Analysis
Time series analysis is the study of data points collected and ordered over time. It has applications in various fields, including finance, economics, environmental sciences, and biomedical research. Traditional time series analysis methods, such as autoregressive integrated moving average (ARIMA) models, assume that the underlying data follow a linear pattern. However, many real-world phenomena exhibit complex nonlinear behavior that cannot be adequately captured by linear models.
Nonlinear time series analysis aims to overcome these limitations by considering the underlying dynamics and interactions between variables. By exploring the nonlinear relationships within time series data, we can gain deeper insights and improve our understanding of complex systems.
Before diving into the techniques used in nonlinear time series analysis, it’s essential to understand the key differences between linear and nonlinear time series. In linear time series, the relationship between variables can be represented by a linear equation, such as y = mx + b. However, nonlinear time series often exhibit chaotic behavior and intricate patterns that cannot be easily described by simple equations.
Chaotic systems are a prime example of nonlinear behavior. They are sensitive to initial conditions and exhibit a phenomenon known as the butterfly effect, where small changes in initial conditions can lead to significant differences in the long-term behavior of the system. These characteristics make chaotic systems challenging to predict accurately but also provide an opportunity for studying the underlying dynamics through nonlinear analysis.
The delay-coordinate embedding theorem is a fundamental concept in nonlinear time series analysis. It states that even a scalar time series can be embedded in a higher-dimensional space, revealing the underlying dynamics. This embedding allows us to uncover hidden structures and relationships that are not apparent in the original data.
Preprocessing Time Series Data for Nonlinear Analysis
Before applying nonlinear analysis techniques to time series data, it’s crucial to preprocess the data properly. This preprocessing step ensures that the data is clean, consistent, and suitable for analysis. Some common preprocessing steps include data cleaning to handle missing values, resampling to adjust the temporal resolution, and normalization or standardization to remove scale differences between variables.
Data cleaning involves identifying and handling missing values in the time series. Missing values can occur due to various reasons, such as sensor failures or data transmission errors. Imputation methods, such as linear interpolation or mean substitution, can be used to fill in the missing values based on neighboring observations.
Resampling is useful when the temporal resolution of the data is inconsistent or needs to be adjusted. For example, if the original data is collected at irregular intervals, resampling can be performed to obtain a fixed temporal resolution, such as hourly or daily intervals.
Normalization and standardization are essential to remove any scale differences between variables. Normalization scales the data to a specified range, typically between 0 and 1, while standardization transforms the data to have zero mean and unit variance. These transformations ensure that all variables contribute equally to the analysis and prevent any dominance by variables with larger scales.
Nonlinear Time Series Analysis Techniques
Nonlinear time series analysis encompasses a wide range of techniques that can be used to uncover and analyze the underlying dynamics within the data. Some of the commonly used techniques include:
Recurrence plots and quantification analysis: Recurrence plots visualize the recurrence of similar patterns in a time series. By quantifying the properties of recurrence plots, such as recurrence rate or determinism, we can characterize the complexity and predictability of the time series.
Lyapunov exponents and chaos theory: Lyapunov exponents measure the rate of exponential divergence or convergence of nearby trajectories in a dynamical system. They provide insights into the sensitivity to initial conditions and can help identify chaotic behavior in a time series.
Correlation dimension and fractal analysis: The correlation dimension measures the embedding dimension of a time series, indicating the number of variables needed to capture the underlying dynamics accurately. The fractal analysis explores the self-similarity and complexity of time series data using techniques like the box-counting method or the Hurst exponent.
Nonlinear forecasting methods: Nonlinear forecasting methods aim to predict future values of a time series based on its past behavior. State-space reconstruction techniques, such as delay-coordinate embedding, can capture the underlying dynamics and make predictions. Machine learning approaches, including neural networks and support vector machines, can also be used for nonlinear time series forecasting.
Implementing Nonlinear Time Series Analysis in R
R is a popular programming language for statistical computing and data analysis, making it well-suited for nonlinear time series analysis. Several R packages provide specialized tools and functions for implementing nonlinear analysis techniques. To get started, you can install and load packages like TISEAN, nonlinearTseries, or chaos.
Once the necessary packages are installed, you can load your time series data into R and visualize it using plots or time series diagrams. R provides a range of plotting functions and libraries, such as ggplot2 or plotly, to create interactive and informative visualizations of your time series.
After visualizing the data, you can apply specific nonlinear analysis techniques using the functions provided by the chosen packages. These functions will calculate the desired metrics or perform the necessary computations to uncover the nonlinear dynamics within the time series.
Case Study: Predicting Stock Market Prices Using Nonlinear Time Series Analysis
To illustrate the practical application of nonlinear time series analysis, let’s consider a case study on predicting stock market prices. Stock market data is inherently complex and nonlinear, making it an ideal candidate for nonlinear analysis techniques.
First, we collect historical stock markets data, such as daily closing prices and trading volumes. We preprocess the data by handling missing values, resampling to a consistent interval, and normalizing the variables.
Next, we apply nonlinear analysis techniques, such as state-space reconstruction or neural networks, to predict future stock prices based on historical data. These techniques capture the nonlinear relationships between variables and leverage the patterns and dependencies within the time series.
To evaluate the performance of the prediction model, we compare the predicted prices with the actual prices. Various performance metrics, such as mean squared error or accuracy, can be calculated to assess the accuracy and reliability of the predictions.
Limitations and Challenges in Nonlinear Time Series Analysis
While nonlinear time series analysis offers valuable insights into complex systems, it also faces certain limitations and challenges. Some of the key limitations include:
The curse of dimensionality: As the number of variables or dimensions increases, the complexity of the analysis grows exponentially. Analyzing high-dimensional time series data requires careful consideration of computational resources and appropriate dimension reduction techniques.
Sensitivity to initial conditions and noise: Nonlinear analysis techniques can be sensitive to small changes in initial conditions or noise present in the data. Robustness measures and noise-filtering methods should be employed to mitigate these effects.
Overfitting and model complexity: Nonlinear analysis techniques often involve complex models with many parameters. It’s crucial to balance model complexity with the available data and avoid overfitting, which can lead to poor generalization and inaccurate predictions.
Practical Applications of Nonlinear Time Series Analysis
Nonlinear time series analysis finds applications in various fields due to its ability to capture complex dynamics and uncover hidden patterns. Some practical applications include:
Finance and stock market prediction: Nonlinear analysis techniques are widely used in finance to predict stock market prices, identify market trends, and assess risk.
Environmental and climate studies: Understanding the nonlinear behavior of environmental phenomena, such as weather patterns or ocean currents, is crucial for climate modeling and predicting natural disasters.
Biomedical signal analysis: Nonlinear analysis is used to analyze physiological signals, such as EEG or ECG data, to detect anomalies, diagnose diseases, and predict patient outcomes.
Engineering and control systems: Nonlinear analysis helps optimize complex systems, such as power grids, manufacturing processes, or robotic systems, by identifying nonlinear relationships and controlling system behavior.
Implementing nonlinear time series analysis in R allows us to leverage the rich ecosystem of packages and functions specifically designed for this purpose. By preprocessing the data, applying appropriate analysis techniques, and interpreting the results, we can uncover hidden patterns, predict future behavior, and make informed decisions in various domains.
FAQs
Q: What are some common nonlinear time series analysis methods? A: Some common methods include recurrence plots, Lyapunov exponents, correlation dimension analysis, and nonlinear forecasting techniques like state-space reconstruction or neural networks.
Q: How can I handle missing values in time series data? A: Missing values can be handled using imputation techniques such as linear interpolation or mean substitution based on neighboring observations.
Q: Is R the only programming language for nonlinear analysis? A: No, there are other programming languages like Python, MATLAB, or Julia that offer similar capabilities for nonlinear time series analysis. R is popular due to its extensive statistical libraries and dedicated packages for nonlinear analysis.
Q: Can nonlinear analysis techniques be applied to real-time data? A: Yes, nonlinear analysis techniques can be applied to real-time data. However, it may require efficient algorithms and computational resources to process the data in real time.
Q: Are there any limitations to nonlinear time series analysis? A: Yes, some limitations include the curse of dimensionality, sensitivity to initial conditions and noise, and the risk of overfitting and model complexity. These limitations should be considered when applying nonlinear analysis techniques.
Data visualization is a powerful tool that allows us to represent complex data in a visual format, making it easier to understand and extract insights. Among the various programming languages used for data visualization, R stands out as a popular choice due to its extensive libraries and capabilities. In this article, we will explore the world of data visualization in R and demonstrate its effectiveness through 100 practical examples.
1. Understanding Data Visualization
Data visualization is the graphical representation of data using visual elements such as charts, graphs, and maps. It helps in the exploration, analysis, and communication of data patterns, trends, and relationships.
Data visualization plays a crucial role in data analysis and decision-making processes. It enables us to identify patterns, spot outliers, and uncover insights that may not be apparent from raw data alone. Visualizations simplify complex information, making it accessible to a broader audience.
1.2 Benefits of Data Visualization
Effective data visualization offers several benefits. It enhances data comprehension, aids in storytelling, improves data-driven decision-making, and facilitates the communication of complex ideas. Visualizations can also reveal hidden patterns, correlations, and trends that might otherwise go unnoticed.
2. Introduction to R
R is a popular programming language and environment for statistical computing and graphics. It provides various packages and libraries specifically designed for data analysis and visualization.
2.1 Why R for Data Visualization?
R offers a vast collection of packages dedicated to data visualization, including ggplot2, plotly, lattice, and many more. These packages provide extensive functionality, customization options, and the ability to create visually appealing and informative plots.
2.2 Installing R and Required Packages
To get started with R and its visualization packages, you need to install R on your computer. Visit the official R website (https://www.r-project.org) to download and install the latest version. Additionally, you can install specific packages using the install.packages() function within R.
3. Basic Data Visualization in R
In this section, we will explore basic data visualization techniques in R, using both base R graphics and the ggplot2 package.
3.1 Creating Plots using Base R Graphics
Base R graphics provide a foundation for creating various types of plots, including scatter plots, line plots, bar plots, and histograms. We can customize these plots by modifying colors, labels, titles, and other parameters.
3.2 Customizing Plots with ggplot2
The ggplot2 package is a powerful data visualization library in R. It follows a layered approach to creating plots, allowing for easy customization and flexibility. With ggplot2, we can build aesthetically pleasing and publication-quality visualizations.
4. Advanced Data Visualization in R
Beyond the basics, R offers advanced techniques for data visualization. Let’s explore two such methods: Shiny and Leaflet.
4.1 Interactive Visualizations with Shiny
Shiny is an R package that enables the creation of interactive web applications. By combining R code with web development frameworks, we can build interactive dashboards and visualizations allowing users to dynamically explore data.
4.2 Geographic Data Visualization with Leaflet
Leaflet is an R package for creating interactive maps. It provides a simple and intuitive interface to generate maps with markers, polygons, and other geographical overlays. Leaflet empowers us to visualize spatial data and explore geographic patterns effectively.
5. Data Visualization Best Practices
To create effective visualizations, it is essential to follow certain best practices. Let’s explore some key considerations when designing visualizations in R.
5.1 Choosing the Right Chart Type
Selecting the appropriate chart type is crucial to convey data accurately. We will discuss different chart types and their best applications, ensuring that the chosen visualization aligns with the data’s characteristics.
5.2 Design Principles for Effective Visualization
Effective data visualization is not just about choosing the right chart type; it also involves careful design considerations. We will cover principles such as color selection, labeling, layout, and the use of visual cues to enhance the impact and clarity of the visualizations.
Python, a versatile and widely-used programming language, owes much of its popularity to the extensive collection of packages available for developers. Python packages are pre-written sets of code, modules, and resources that extend the functionality of Python and help streamline development processes. In this article, we will explore the world of Python package, their benefits, installation methods, best practices, and more.
Benefits of using Python Packages
Python packages offer numerous benefits to developers. Firstly, they save time and effort by providing ready-to-use code for common tasks. Instead of reinventing the wheel, developers can leverage existing packages and focus on solving unique challenges. Additionally, Python packages enhance code readability and maintainability by organizing functionality into modular units. They promote code reuse and collaboration, making it easier for teams to work together efficiently.
Python boasts a rich ecosystem of packages catering to diverse domains and use cases. Some of the most popular Python packages include:
NumPy: A fundamental package for scientific computing with support for powerful array operations, linear algebra, and numerical computations.
Pandas: Widely used for data manipulation and analysis, Pandas provides data structures and functions to handle structured data efficiently.
Matplotlib: A versatile plotting library that enables the creation of static, animated, and interactive visualizations in Python.
TensorFlow: Popular in the field of machine learning, TensorFlow offers a comprehensive set of tools for building and training neural networks.
Django: A high-level web framework that simplifies web development by providing robust features for building scalable and secure web applications.
These packages are just a glimpse of the vast array of tools available in the Python ecosystem, catering to various domains such as data science, web development, artificial intelligence, and more.
How to install Python packages
Installing Python packages is a straightforward process. The most common method is using the pip package manager, which comes bundled with Python. Here are the steps to install a package using pip:
Open your command-line interface or terminal.
Type pip install package_name and press Enter. Replace package_name with the name of the package you want to install.
Pip will download and install the package along with its dependencies.
Alternatively, you can use an integrated development environment (IDE) like PyCharm or Anaconda Navigator to install packages through a user-friendly interface.
Managing Python packages with pip
Once you have installed a Python package, pip provides various commands to manage them effectively. Here are some useful pip commands:
pip list: Displays the installed packages and their versions.
pip show package_name: Provides detailed information about a specific package.
pip search package_name: Searches the Python Package Index (PyPI) for packages related to your query.
pip install --upgrade package_name: Upgrades a package to the latest available version.
pip uninstall package_name: Uninstalls a package from your Python environment.
Upgrading and uninstalling Python packages
Regularly updating Python packages is crucial to benefit from bug fixes, performance improvements, and new features. To upgrade a package, use the pip install --upgrade package_name command mentioned earlier. If you want to uninstall a package, utilize the pip uninstall package_name command.
Creating your own Python package
As a Python developer, you may find the need to create your own packages to encapsulate reusable code or share your work with others. Creating a Python package involves the following steps:
Structuring your package directory with the required files and folders.
Adding a setup.py file to define metadata and dependencies.
Writing the package’s code and modules.
Testing the package to ensure its functionality.
Distributing the package by uploading it to PyPI or sharing it through version control systems like GitHub.
Best practices for using Python packages
To make the most out of Python packages, it’s essential to follow some best practices:
Always use virtual environments to isolate package installations and avoid conflicts.
Specify package versions in your project’s requirements file to ensure reproducibility.
Document your code and provide clear instructions for others to use your packages.
Contribute to open-source packages by reporting issues, submitting bug fixes, or adding new features.
Stay updated with package releases and security advisories to maintain a secure development environment.
Troubleshooting common issues with Python packages
While using Python packages, you may encounter some common issues. Here are a few troubleshooting tips:
If a package installation fails, ensure you have the necessary dependencies installed.
Check the package’s documentation and online forums for solutions to common problems.
If you encounter compatibility issues, try using a different version of the package or consult the package’s documentation for guidance.
Make sure you are installing packages compatible with your Python version and operating system.
The future of Python packages
As Python continues to evolve, the ecosystem of Python packages will grow even larger. New packages will emerge, addressing the needs of emerging technologies and industries. With the increasing popularity of data science, machine learning, and web development, Python packages will play a vital role in driving innovation and empowering developers worldwide.
FAQs
FAQ 1: What are some essential Python packages for data analysis?
Some essential Python packages for data analysis include NumPy, Pandas, Matplotlib, and SciPy. These packages provide powerful tools for data manipulation, visualization, and statistical analysis.
FAQ 2: Can I use Python packages in different operating systems?
Yes, Python packages are designed to be cross-platform. They can be used in various operating systems such as Windows, macOS, and Linux, as long as the required dependencies are met.
FAQ 3: How can I contribute to an open-source Python package?
To contribute to an open-source Python package, you can start by exploring the package’s repository on platforms like GitHub. You can report issues, submit bug fixes, add new features, or even write documentation to help improve the package.
FAQ 4: Is it possible to use multiple versions of the same Python package?
Yes, it is possible to use multiple versions of the same Python package by utilizing virtual environments. Virtual environments allow you to create isolated Python environments with their own set of packages, including different versions.
FAQ 5: What should I do if I encounter a compatibility issue with a Python package?
If you encounter a compatibility issue with a Python package, you can try using a different version of the package that is compatible with your Python environment. Additionally, you can consult the package’s documentation or community forums for guidance on resolving compatibility issues.
Python has emerged as one of the most popular programming languages for data science. Its simplicity, versatility, and rich ecosystem of libraries and tools make it an ideal choice for working with data. In this article, we will explore the essentials of Python data science, including its importance, setting up the environment, data manipulation, visualization, machine learning, deep learning, model deployment, relevant libraries and tools, best practices, challenges, and future trends.
1. Introduction to Python Data Science
Python data science involves using Python programming language for extracting insights and knowledge from data. It encompasses various tasks such as data cleaning, preprocessing, analysis, visualization, and machine learning. Python’s easy-to-learn syntax and extensive library support have made it a go-to language for data scientists.
Python’s popularity in data science stems from its simplicity, readability, and extensive ecosystem. It provides an intuitive and user-friendly interface to handle complex data operations. Additionally, Python’s libraries, such as NumPy, Pandas, and Matplotlib, offer efficient and powerful tools for data manipulation, analysis, and visualization.
3. Setting up the Python Data Science Environment
Before diving into data science, it’s essential to set up the Python environment. This involves installing Python, along with relevant libraries and tools. Popular choices include Anaconda, which provides a comprehensive Python distribution, and Jupyter Notebooks, which offers an interactive coding environment.
4. Data Manipulation with Python
Data manipulation forms a crucial part of data science. Python provides several libraries, such as Pandas, that simplify data importing, cleaning, preprocessing, and transformation tasks. These libraries allow data scientists to handle various data formats, explore datasets, handle missing values, and create new features for analysis.
4.1 Importing and Exploring Data
Python’s Pandas library offers powerful functions to import data from various sources, including CSV files, databases, and web APIs. Once imported, data scientists can use Pandas’ functionalities to explore the dataset, understand its structure, and get basic statistical insights.
4.2 Data Cleaning and Preprocessing
Data cleaning involves identifying and handling missing values, outliers, and inconsistent data. Python provides tools like Pandas and NumPy that enable efficient data cleaning and preprocessing. These libraries offer functions for imputing missing values, removing outliers, and transforming data into a suitable format for analysis.
4.3 Data Transformation and Feature Engineering
Data transformation involves converting raw data into a suitable format for analysis. Python libraries like Pandas provide functions for transforming variables, scaling data, and encoding categorical features. Feature engineering, on the other hand, involves creating new features from existing ones to improve model performance. Python’s libraries offer numerous techniques for feature engineering, such as one-hot encoding, binning, and polynomial features.
5. Data Visualization with Python
Data visualization plays a vital role in understanding and communicating insights from data. Python offers several libraries, including Matplotlib, Seaborn, and Plotly, that facilitate the creation of static and interactive visualizations. These libraries provide a wide range of plot types, customization options, and interactive features to effectively convey data patterns and relationships.
5.1 Plotting Libraries and Packages
Matplotlib is a popular plotting library in Python that provides a flexible and comprehensive set of functions for creating static visualizations. Seaborn, built on top of Matplotlib, offers additional functionalities for statistical visualizations. Plotly, on the other hand, specializes in interactive and web-based visualizations.
5.2 Creating Basic and Advanced Visualizations
Python’s plotting libraries allow data scientists to create a variety of visualizations, including scatter plots, line charts, bar graphs, histograms, heatmaps, and more. With customizable options, labels, and annotations, Python enables the creation of visually appealing and informative plots.
5.3 Interactive Visualizations with Python
Interactive visualizations enhance the data exploration experience by allowing users to interact with the plots. Python libraries like Plotly, Bokeh, and Altair provide interactive capabilities, enabling zooming, panning, hovering, and filtering on the visualizations. These libraries are particularly useful for creating dashboards and interactive web applications.
6. Machine Learning with Python
Machine learning is a core component of data science. Python offers numerous libraries, such as Scikit-learn and TensorFlow, that simplify the implementation of machine learning algorithms. These libraries provide a wide range of supervised and unsupervised learning models, as well as tools for model evaluation and selection.
6.1 Introduction to Machine Learning
Machine learning involves training models on data to make predictions or take actions without being explicitly programmed. Python provides a comprehensive set of tools and libraries for various machine-learning tasks, such as classification, regression, clustering, and dimensionality reduction.
6.2 Supervised Learning Algorithms
Supervised learning algorithms learn from labeled data to make predictions or classify new instances. Python’s Scikit-learn library offers a vast collection of supervised learning algorithms, including linear regression, logistic regression, support vector machines, decision trees, and random forests.
6.3 Unsupervised Learning Algorithms
Unsupervised learning algorithms discover patterns and structures in unlabeled data. Python’s Scikit-learn provides a range of unsupervised learning algorithms, such as clustering (k-means, hierarchical clustering) and dimensionality reduction techniques (principal component analysis, t-SNE).
6.4 Model Evaluation and Selection
Evaluating and selecting the best model is crucial for successful machine learning. Python’s Scikit-learn offers functions for assessing model performance using various metrics, such as accuracy, precision, recall, and F1-score. Cross-validation techniques and hyperparameter tuning help optimize model performance and generalize well to unseen data.
7. Deep Learning with Python
Deep learning has revolutionized many areas of data science, including computer vision, natural language processing, and reinforcement learning. Python’s TensorFlow and Keras libraries provide powerful frameworks for building and training deep neural networks.
7.1 Neural Networks and Deep Learning
Neural networks are computational models inspired by the human brain. Deep learning involves training neural networks with multiple hidden layers. Python’s TensorFlow and Keras libraries provide high-level APIs for defining and training neural networks, making them accessible even to beginners.
7.2 Building Deep Learning Models with Python
Python’s TensorFlow and Keras libraries offer a wide range of pre-built layers and models, enabling data scientists to create deep learning models with ease. These libraries also support custom model architectures and provide tools for fine-tuning and transfer learning.
7.3 Training and Fine-tuning Models
Deep learning models require significant computational resources and training data. Python’s libraries support training models on CPUs, GPUs, and distributed systems. Transfer learning allows leveraging pre-trained models on large datasets to improve performance on specific tasks with limited data.
7.4 Applications of Deep Learning in Data Science
Deep learning has found applications in various domains, such as image classification, object detection, natural language processing, and recommendation systems. Python’s deep learning libraries enable data scientists to tackle complex problems and extract meaningful insights from unstructured data.
8. Deploying Python Data Science Models
Deploying data science models to production is crucial for real-world impact. Python offers several options for deploying models, including creating APIs, building web applications and dashboards, and leveraging cloud services for scalability.
8.1 Model Deployment Options
Python provides frameworks like Flask and Django for creating APIs that expose data science models as web services. These APIs allow other applications to make predictions or retrieve insights from the models. Additionally, deploying models as web applications or dashboards provides a user-friendly interface for interacting with the models.
8.2 Building APIs with Python
Python’s Flask and Django frameworks simplify the creation of APIs. They handle routing, request handling, and response generation, making it easier to expose data science models as web services. With Python, data scientists can create RESTful APIs that can be integrated into various applications.
8.3 Web Applications and Dashboards
Python’s web frameworks, such as Flask and Django, enable data scientists to build interactive web applications and dashboards. These applications provide a graphical interface for users to input data, visualize results, and interact with the underlying data science models.
8.4 Cloud Deployment and Scalability
Cloud services like Amazon Web Services (AWS), Microsoft Azure, and Google Cloud Platform (GCP) offer scalable infrastructure for deploying data science models. Python provides libraries and SDKs for interacting with cloud services, allowing data scientists to leverage cloud computing resources and easily scale their applications.
9. Python Data Science Libraries and Tools
Python’s data science ecosystem is rich with libraries and tools that enhance productivity and extend functionality. Some essential libraries for data science include NumPy, Pandas, Matplotlib, SciPy, Scikit-learn, and TensorFlow. Jupyter Notebooks and integrated development environments (IDEs) like PyCharm and Visual Studio Code provide a seamless coding experience.
NumPy is a fundamental library for numerical computations in Python. It provides support for multi-dimensional arrays and efficient mathematical operations. Pandas, built on top of NumPy, offers high-level data structures and functions for data manipulation and analysis. Matplotlib enables the creation of various plots and visualizations.
9.2 SciPy, Scikit-learn, and TensorFlow
SciPy is a library that builds on NumPy and provides additional scientific and numerical computing capabilities. It offers functions for optimization, integration, interpolation, and more. Scikit-learn is a versatile machine-learning library that provides tools for data preprocessing, model selection, and evaluation. TensorFlow, developed by Google, is a powerful framework for building and training machine learning and deep learning models.
9.3 Jupyter Notebooks and IDEs
Jupyter Notebooks provide an interactive and collaborative coding environment for data scientists. They allow for combining code, visualizations, and narrative explanations in a single document. Integrated development environments like PyCharm and Visual Studio Code offer powerful features such as code debugging, version control integration, and code suggestions, enhancing the development experience.
10. Best Practices in Python Data Science
Adhering to best practices ensures efficient and reproducible data science workflows. It involves considerations such as data exploration, version control, documentation, testing, and performance optimization.
10.1 Data Science Workflow
A well-defined data science workflow encompasses steps such as problem formulation, data collection, data preprocessing, model development, model evaluation, and deployment. Following a structured workflow improves productivity and ensures the reliability of results.
10.2 Version Control and Collaboration
Version control systems like Git enable tracking changes in code and collaboration among team members. Using Git repositories ensures proper documentation, allows for reverting changes, and facilitates collaboration on data science projects.
10.3 Documentation and Testing
Documentation is essential for maintaining code readability and understanding. Data scientists should document their code, including functions, classes, and workflows, to enable easy comprehension by others. Testing the code with appropriate test cases ensures its correctness and reliability.
10.4 Performance Optimization
Python provides optimization techniques, such as vectorization and parallelization, to improve code performance. Additionally, using optimized libraries and data structures, caching results, and optimizing algorithms can significantly enhance the speed and efficiency of data science workflows.
11. Challenges and Future Trends in Python Data Science
As data science evolves, new challenges and trends emerge. Data scientists need to be aware of these challenges and stay updated with the latest advancements to stay competitive.
11.1 Big Data and Distributed Computing
As the volume of data grows, processing and analyzing big data become challenging. Distributed computing frameworks like Apache Hadoop and Apache Spark, along with Python libraries like PySpark, address these challenges by enabling distributed data processing and analysis.
11.2 Explainable AI and Ethical Considerations
As AI and machine learning models become more complex, explainability becomes crucial. Data scientists need to interpret and explain the decisions made by models. Additionally, ethical considerations, such as bias in data and models, fairness, and privacy, need to be addressed in data science projects.
11.3 Automation and AutoML
Automated machine learning (AutoML) techniques aim to automate various stages of the data science workflow, from data preprocessing to model selection and tuning. Python libraries like H2O and Auto-Sklearn provide AutoML capabilities, making it easier for non-experts to leverage data science.
11.4 Reinforcement Learning and AI Integration
Reinforcement learning, a branch of machine learning, focuses on training agents to make decisions through trial and error. Python libraries like OpenAI Gym enable reinforcement learning experimentation. Integration of AI into various domains, such as healthcare, finance, and robotics, is an emerging trend.
FAQs
Q1: Is Python the best programming language for data science? Yes, Python is widely regarded as one of the best programming languages for data science due to its extensive libraries, ease of use, and versatility.
Q2: What are some popular Python libraries for data science? Some popular Python libraries for data science include NumPy, Pandas, Matplotlib, Scikit-learn, TensorFlow, and Keras.
Q3: Can I use Python for both machine learning and deep learning? Absolutely! Python provides libraries like Scikit-learn for traditional machine learning and TensorFlow and Keras for deep learning.
Q4: Are there any challenges in data science that Python can’t handle? While Python is a powerful language for data science, handling extremely large-scale data processing might require distributed computing frameworks like Apache Spark.
Q5: Where can I learn Python for data science? There are several online resources, tutorials, and courses available for learning Python for data science. Websites like Coursera, Udemy, and DataCamp offer comprehensive courses for beginners and experienced professionals.
The Art of Data Science: Data science has emerged as a critical field in the digital age, revolutionizing the way businesses make decisions and uncover insights. From analyzing customer behavior to predicting market trends, data science plays a vital role in various industries. The Art of Data Science aims to provide a comprehensive overview of data science, its importance, and the skills required to excel in this field.
1. IntroductiontoThe Art of Data Science:
In today’s data-driven world, the ability to extract meaningful information from vast amounts of data is invaluable. Data science combines statistical analysis, machine learning, and programming to extract actionable insights. It encompasses a wide range of techniques and methodologies aimed at understanding complex data sets and driving data-informed decision-making.
The Art of Data Science A Guide for Anyone Who Works with Data
Data science is an interdisciplinary field that involves extracting knowledge and insights from structured and unstructured data. It combines elements of statistics, mathematics, computer science, and domain knowledge to discover patterns, make predictions, and solve complex problems. Data scientists utilize various tools, algorithms, and programming languages to analyze data and derive valuable insights.
3. The Role of a Data Scientist
A data scientist is a professional responsible for analyzing, interpreting, and deriving insights from data. Their role involves formulating questions, collecting and cleaning data, applying statistical and machine-learning techniques, and communicating findings to stakeholders. Data scientists play a crucial role in shaping data-driven strategies and making informed business decisions.
4. Essential Skills for Data Science
To succeed in the field of data science, several essential skills are required. These include:
4.1 Programming and Software Engineering
Proficiency in programming languages like Python, R, or SQL is essential for data scientists. They should be able to write efficient code, manipulate data, and build machine learning models.
4.2 Statistics and Mathematics
A strong foundation in statistics and mathematics is vital for data scientists. They should be familiar with probability theory, hypothesis testing, regression analysis, and other statistical concepts.
4.3 Data Visualization
Data scientists need to be proficient in visualizing data effectively. They should be able to create informative and visually appealing charts, graphs, and dashboards to communicate insights to non-technical stakeholders.
4.4 Machine Learning and AI
Data scientists must have a solid understanding of machine learning algorithms and artificial intelligence techniques. They should be able to select appropriate models, train them on data, and evaluate their performance.
5. Steps in the Data Science Process
Data science projects typically follow a well-defined process that involves the following steps:
5.1 Problem Formulation
Defining the problem and formulating relevant questions to guide the data analysis process.
5.2 Data Collection and Preparation
Gathering relevant data from various sources and preparing it for analysis, including data cleaning, integration, and transformation.
5.3 Exploratory Data Analysis (EDA)
Exploring the data to gain insights, identify patterns, and understand the underlying structure. EDA involves visualizations, summary statistics, and hypothesis testing.
5.4 Data Modeling and Machine Learning
Building predictive or descriptive models using machine learning algorithms. This step involves feature selection, model training, and evaluation.
5.5 Model Evaluation and Deployment
Assessing the performance of the models and deploying them for real-world applications.
5.6 Communication and Visualization
Presenting the findings and insights derived from the data analysis in a clear and understandable manner to stakeholders.
6. Collecting and Preparing Data
Data collection is a crucial step in the data science process. It involves identifying relevant data sources, acquiring the data, and ensuring its quality and integrity. Proper data preparation, including cleaning, transforming, and integrating data, is essential to ensure accurate and meaningful analysis.
7. Exploratory Data Analysis
Exploratory Data Analysis (EDA) involves examining the data to discover patterns, relationships, and outliers. Through visualizations, summary statistics, and hypothesis testing, data scientists gain a deeper understanding of the data, uncover hidden insights, and identify potential challenges.
8. Data Modeling and Machine Learning
Data modeling involves the construction of mathematical models to represent real-world phenomena. In data science, it refers to the development and implementation of machine learning algorithms to make predictions or derive insights from data. Model selection, training, and evaluation are crucial steps in this process.
9. Data Visualization
Data visualization plays a significant role in data science as it helps communicate complex findings in a visually appealing and accessible manner. Through the use of charts, graphs, and interactive dashboards, data scientists can effectively convey insights to a broader audience.
10. Data Science Tools and Technologies
Data science relies on a variety of tools and technologies to analyze and manipulate data effectively. Some popular tools include Python libraries like NumPy, Pandas, and scikit-learn, as well as visualization tools like Tableau and Power BI. Additionally, programming languages such as R and SQL are commonly used in data science projects.
11. Challenges in Data Science
Data science projects come with their fair share of challenges. Some common challenges include data quality issues, lack of domain expertise, ethical considerations, and interpretability of machine learning models. Overcoming these challenges requires a combination of technical skills, critical thinking, and domain knowledge.
12. Ethical Considerations in Data Science
Data scientists must be mindful of ethical considerations when working with data. Privacy, security, and bias are critical concerns that need to be addressed to ensure responsible and ethical data practices. Data scientists should strive to use data in a way that respects individual privacy rights and minimizes bias and discrimination.
13. The Future of Data Science
As technology advances and data availability continues to grow, the field of data science is expected to evolve rapidly. Emerging technologies like artificial intelligence, big data analytics, and the Internet of Things (IoT) will shape the future of data science, offering new opportunities and challenges.
FAQs
Q1. What qualifications do I need to become a data scientist?
To become a data scientist, a strong educational background in fields like computer science, mathematics, statistics, or engineering is beneficial. Additionally, acquiring relevant certifications and gaining hands-on experience with data analysis tools and techniques can greatly enhance your prospects in this field.
Q2. What industries can benefit from data science?
Data science has applications in various industries, including finance, healthcare, retail, marketing, and manufacturing. Any industry that generates and collects data can leverage data science to gain insights, improve decision-making, and optimize operations.
Q3. Is programming knowledge necessary for data science?
Yes, programming knowledge is essential for data science. Proficiency in programming languages like Python or R allows data scientists to manipulate and analyze data efficiently and build machine learning models.
Q4. What are the key challenges in data science?
Some key challenges in data science include data quality issues, lack of interpretability in machine learning models, data privacy concerns, and the need for continuous learning and keeping up with evolving technologies.
Q5. How can I stay updated with the latest developments in data science?
To stay updated with the latest developments in data science, you can join online communities, attend webinars and conferences, read industry publications and blogs, and participate in online courses or training programs.
An Introduction to R: Are you interested in learning a powerful and versatile programming language for data analysis and statistical computing? Look no further! In this article, we will provide you with a comprehensive introduction to R, a popular language among data scientists and statisticians. Whether you are a beginner or have some coding experience, this guide will equip you with the knowledge and skills needed to start your journey with R.
What is R?
R is an open-source programming language and software environment specifically designed for statistical computing, data analysis, and graphics. It was created by Ross Ihaka and Robert Gentleman at the University of Auckland, New Zealand in the early 1990s. Since then, R has gained immense popularity and a strong community of users worldwide. Its flexibility, extensive libraries, and powerful features make it a go-to tool for various data-related tasks.
One of the key strengths of R lies in its versatility and flexibility. It provides a wide range of statistical and graphical techniques, making it suitable for various domains such as finance, healthcare, social sciences, and more. With R, you can analyze data, visualize trends, build predictive models, and even create interactive dashboards.
Extensive Package Ecosystem
R boasts a vast ecosystem of packages contributed by its vibrant community of users. These packages extend the functionality of R, allowing you to leverage pre-built functions and algorithms for specific tasks. Whether you need to perform complex statistical analyses, work with large datasets, or create stunning visualizations, chances are there’s a package available in the R ecosystem to help you.
Reproducibility and Collaboration
R promotes reproducibility by providing a transparent and organized way to document and share code and analyses. With R Markdown, you can seamlessly combine code, text, and visualizations into a single document, making it easy to reproduce your work and share it with others. This makes collaboration and knowledge sharing among data scientists and researchers more efficient and effective.
An Introduction to R: Getting Started with R
Installing R
To begin your journey with R, you must install it on your computer first. R is available for Windows, macOS, and Linux operating systems.
Follow the instructions below to install R:
Windows: Visit the R Project website and download the latest version of R for Windows. Run the installer and follow the on-screen instructions.
macOS: Open the Terminal application and enter the following command:Copy codebrew install r This will install R using the Homebrew package manager. If you don’t have Homebrew installed, visit the Homebrew website for instructions.
Linux: Depending on your Linux distribution, you can install R using the package manager. For example, on Ubuntu, you can run the following command:csharpCopy codesudo apt-get install r-base Consult your distribution’s documentation for specific installation instructions.
Getting Started with RStudio
While R can be used through a command-line interface, many users prefer using RStudio, an integrated development environment (IDE) for R. RStudio provides a user-friendly interface, advanced features for code editing and debugging, and seamless integration with R Markdown.
To install RStudio, follow these steps:
Visit the RStudio website and download the free version of RStudio Desktop.
Run the installer and follow the on-screen instructions.
Once installed, open RStudio to start working with R in a more intuitive and productive environment.
Frequently Asked Questions (FAQs)
Q1: Is R suitable for beginners with no programming experience?
Absolutely! R is beginner-friendly and widely used in introductory statistics and data science courses. Its syntax is relatively straightforward, and with the help of resources like online tutorials and documentation, beginners can quickly grasp the basics of R.
Q2: Can I use R for big data analysis?
Certainly! R offers several packages, such as dplyr and data.table, specifically designed for efficient data manipulation and analysis, even with large datasets. Additionally, R integrates well with distributed computing frameworks like Apache Hadoop and Spark, enabling you to work with big data seamlessly.
Q3: Are there any online communities or forums where I can seek help with R?
Absolutely! The R community is known for its active and supportive nature. You can join online forums such as Stack Overflow and RStudio Community to ask questions, seek guidance, and learn from experienced R users.
Q4: Are there any resources to learn R for free?
Yes, there are numerous free resources available to learn R. Websites like DataCamp, Coursera, and RStudio Education offer introductory R courses, tutorials, and interactive exercises. Additionally, the R documentation and online forums provide a wealth of information and examples.
Q5: Can R be used for machine learning?
Absolutely! R provides a rich set of packages, such as caret, mlr, and tensorflow, that facilitate machine learning tasks. From data preprocessing and feature selection to building and evaluating models, R has the tools and resources you need to explore and apply machine learning algorithms.
Q6: Is R compatible with other programming languages?
Yes, R can be easily integrated with other programming languages. For instance, you can use R in combination with Python using the reticulate package, allowing you to leverage the strengths of both languages in a single project. R also provides interfaces to languages like C++, Java, and SQL, enabling seamless integration with existing code and systems.