Today, data science jobs are some of the highest paying occupations on the planet. Data science jobs are on high demand from both the company and employee perspective. The current shortage of big data talent across the globe is well-documented. In 2018, there was a 56% demand for data science jobs in the U.S. So if you’re interested in working within this space, what’s the best approach to finding a job or an internship? You have the usual suspects like Indeed, LinkedIn, and Monster, but these aren’t your only options. There are also niche recruitment portals where you can stand out and make an impression.
Since you’ve done all the hard work studying big data and analytics to get to this point, we did the legwork and put together a list of our 10 favorite data science-related job sites where you can start applying for data science, deep learning (DL), machine learning (ML), and statistical analysis jobs.
1. StackOverflow
StackOverflow is one of the biggest Q&A websites for programming and engineering. It also so happens that they have a job board! This is a great place to check not just for data scientists, but also software engineers and developers.
2. ai-jobs.net
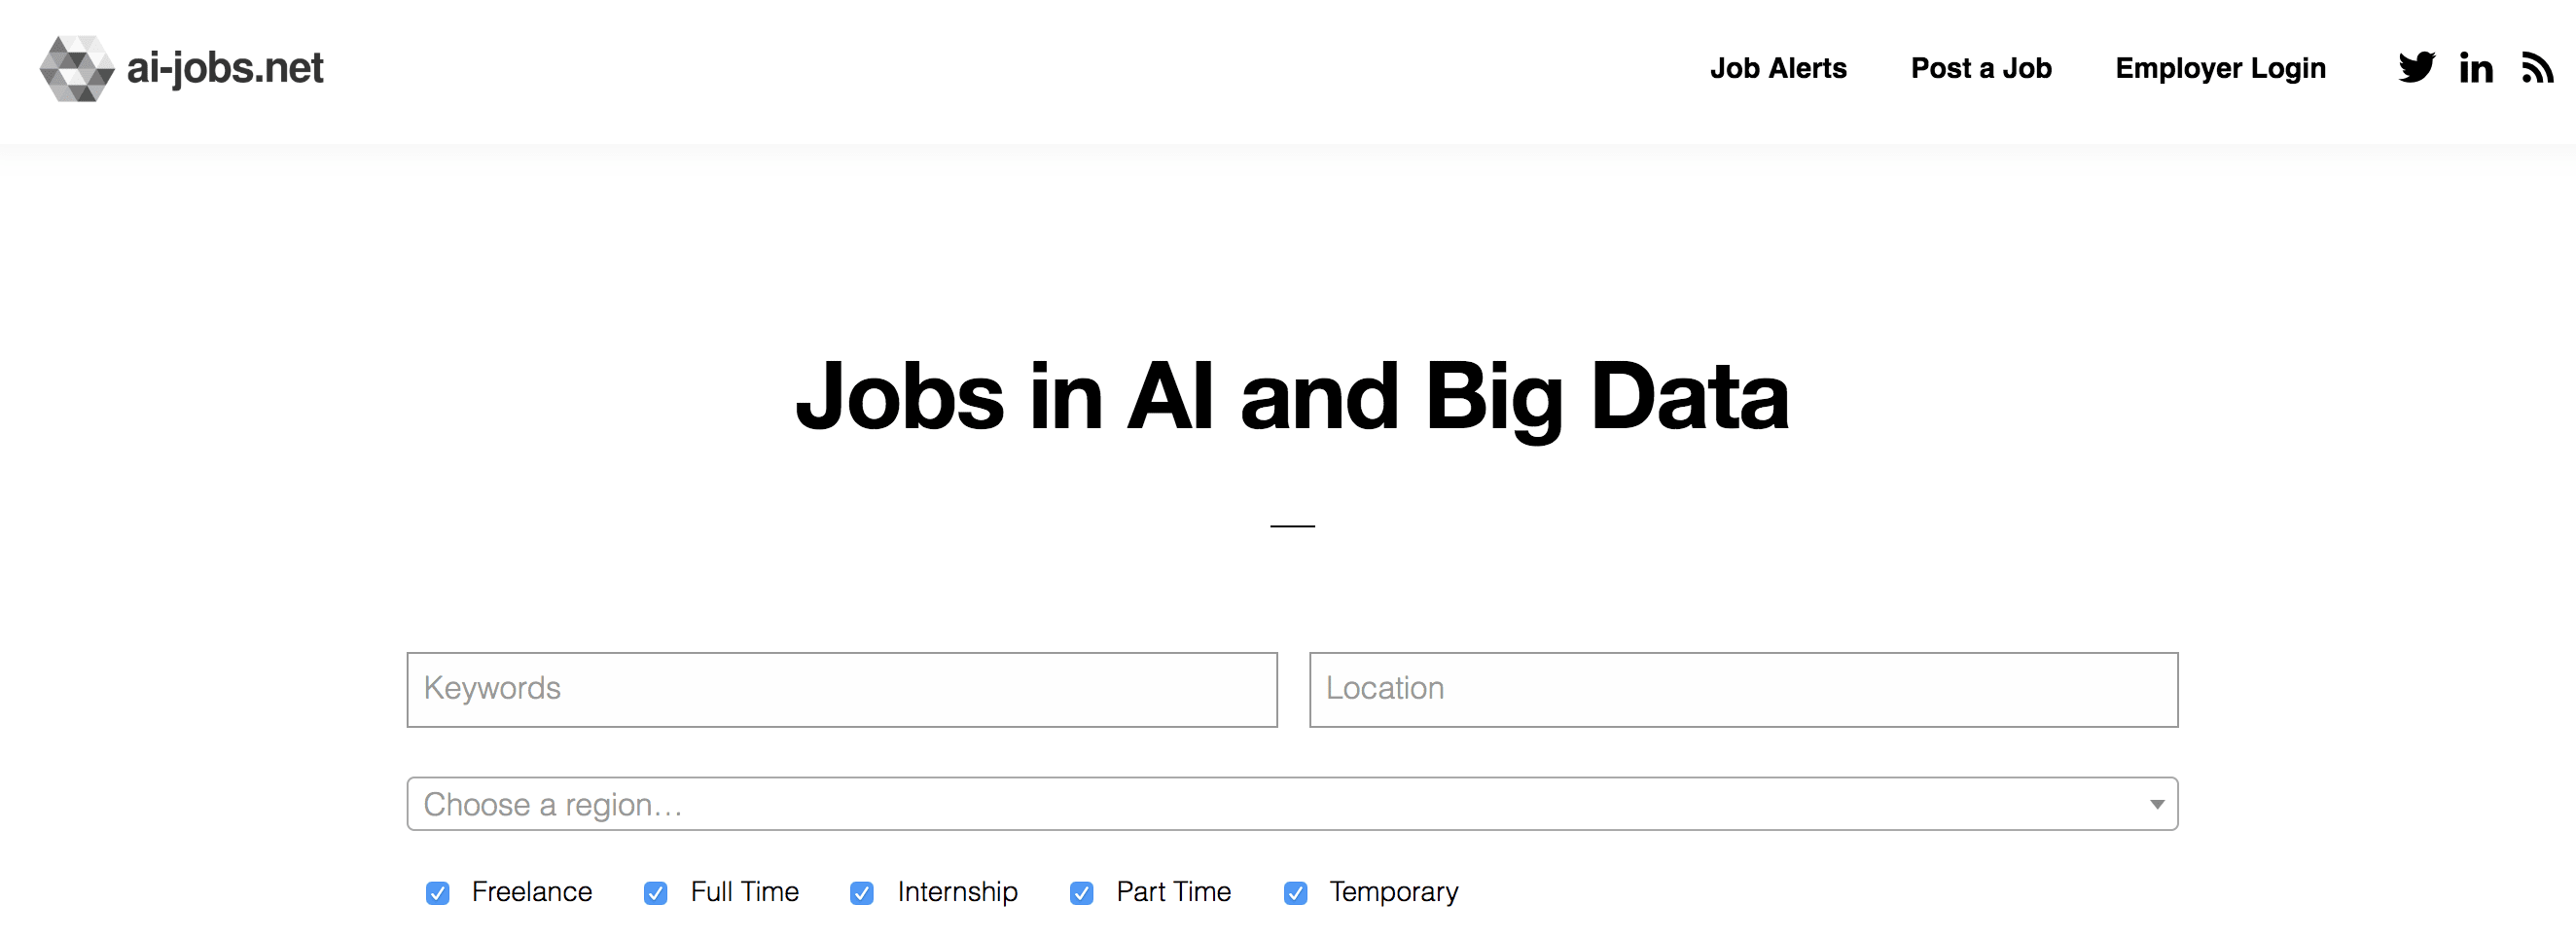
Ai-jobs.net is a job board that specifically serves the artificial intelligence (AI) and data science community. Whether you’re looking for something permanent or a contract role, there’s an option for everyone. The jobs listed on the website can also be found on their Reddit thread. The aim here is to provide a comprehensive and clear listing of jobs related to AI, big data, DL, and ML. So the site is pretty basic, straightforward, and all the focus is on current vacancies.
3. Y Combinator (YC)
Y Combinator is one of the largest seed accelerators in the world and has funded some very established tech companies like Stripe, Airbnb, and DoorDash. They also have a job board that connects you with over 400 startups funded by YC.
4. Amazon Jobs
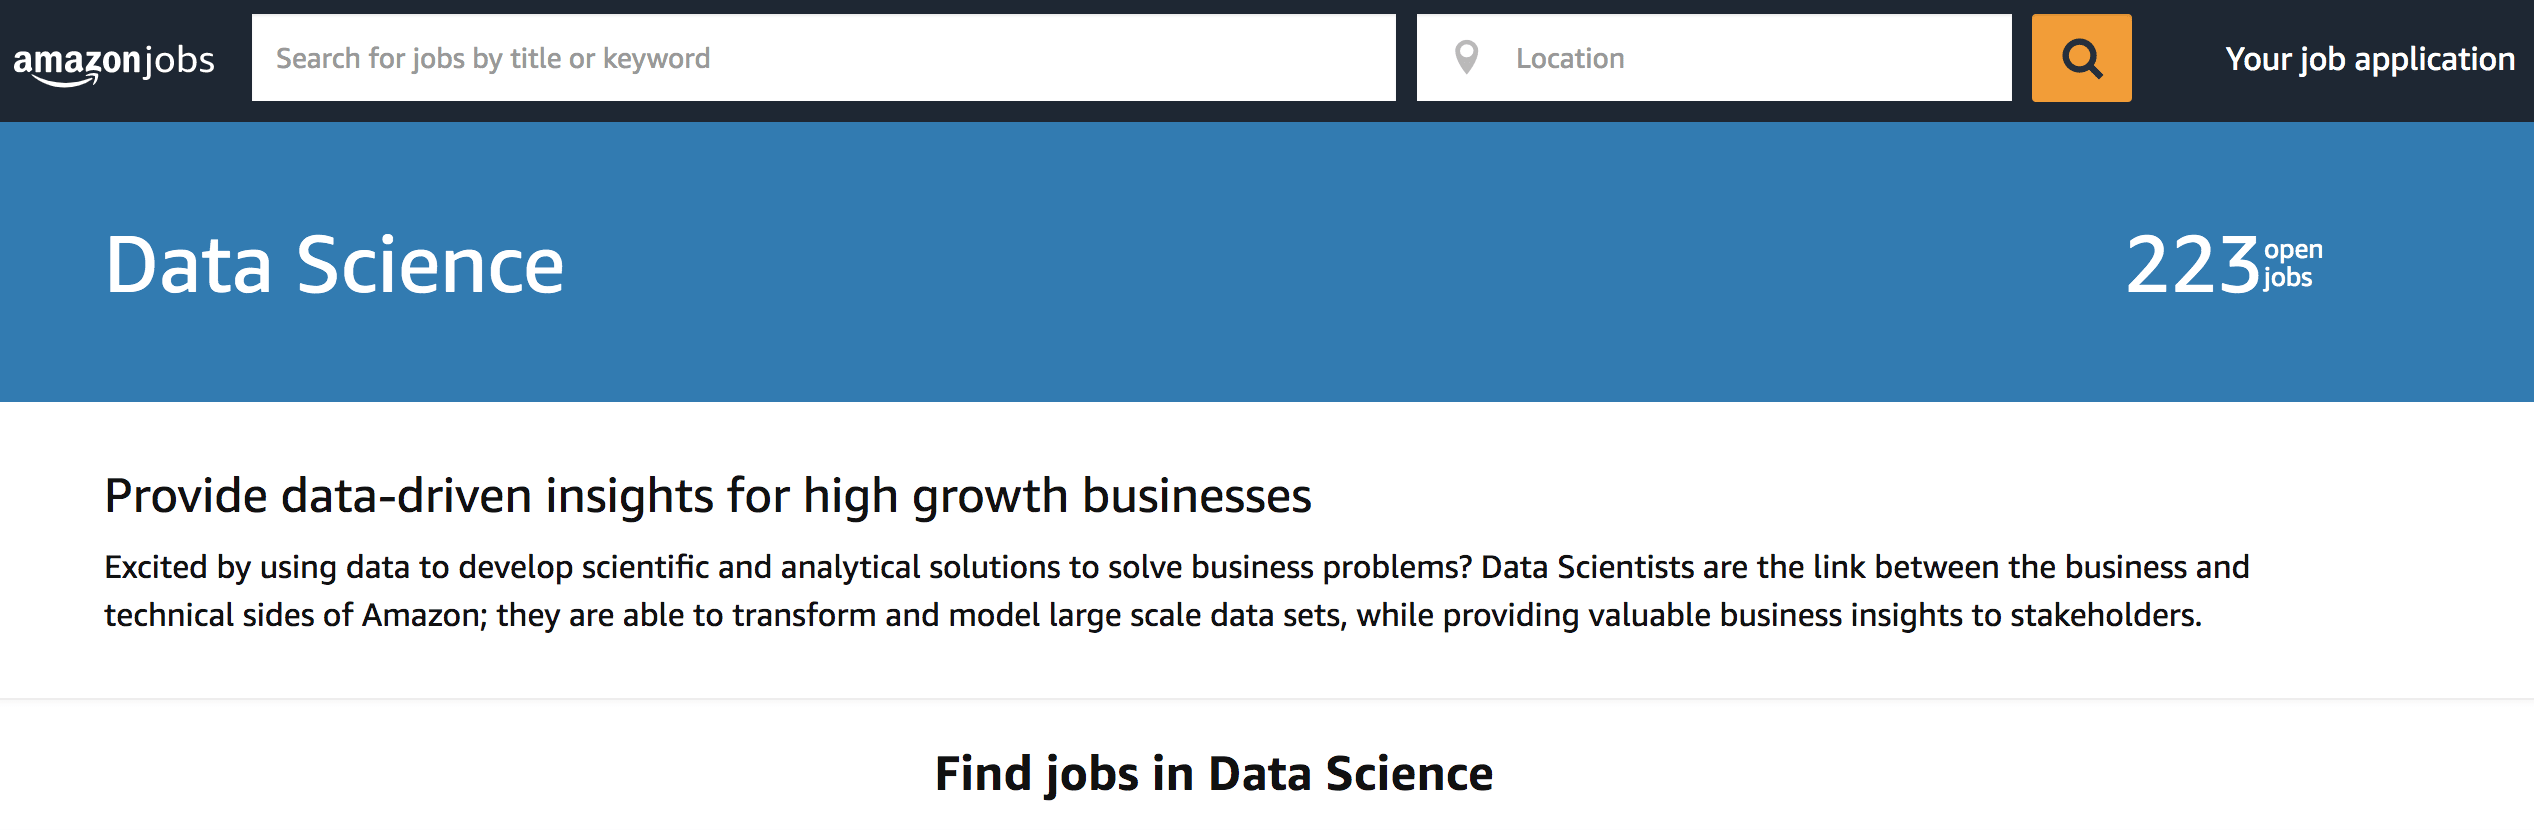
When it comes to data science jobs, Amazon is a leading employer. They have openings for a broad spectrum of roles from Senior Data Scientist – Prime Air to WWPS Data Analyst – Intern. Amazon provides a job opening for a broad spectrum of roles. Being a leader in technology, their job postings are listed on their website. Amazon is of the opinion that data scientists are a significant link between enterprises and the technical side of Amazon. If transforming and modeling data sets and providing insights to stakeholders interests you, Amazon Jobs is an excellent destination for both recent graduates and seasoned professionals.
5. AngelList
AngelList is one of the largest platforms for startups that facilitates investments and recruitment. Like LinkedIn, you’ll create your own profile, fill in your information, and have access to a number of startup jobs. I found that this website is especially good if you’re looking for smaller startups (1–10 people).
6. Analytics Jobs
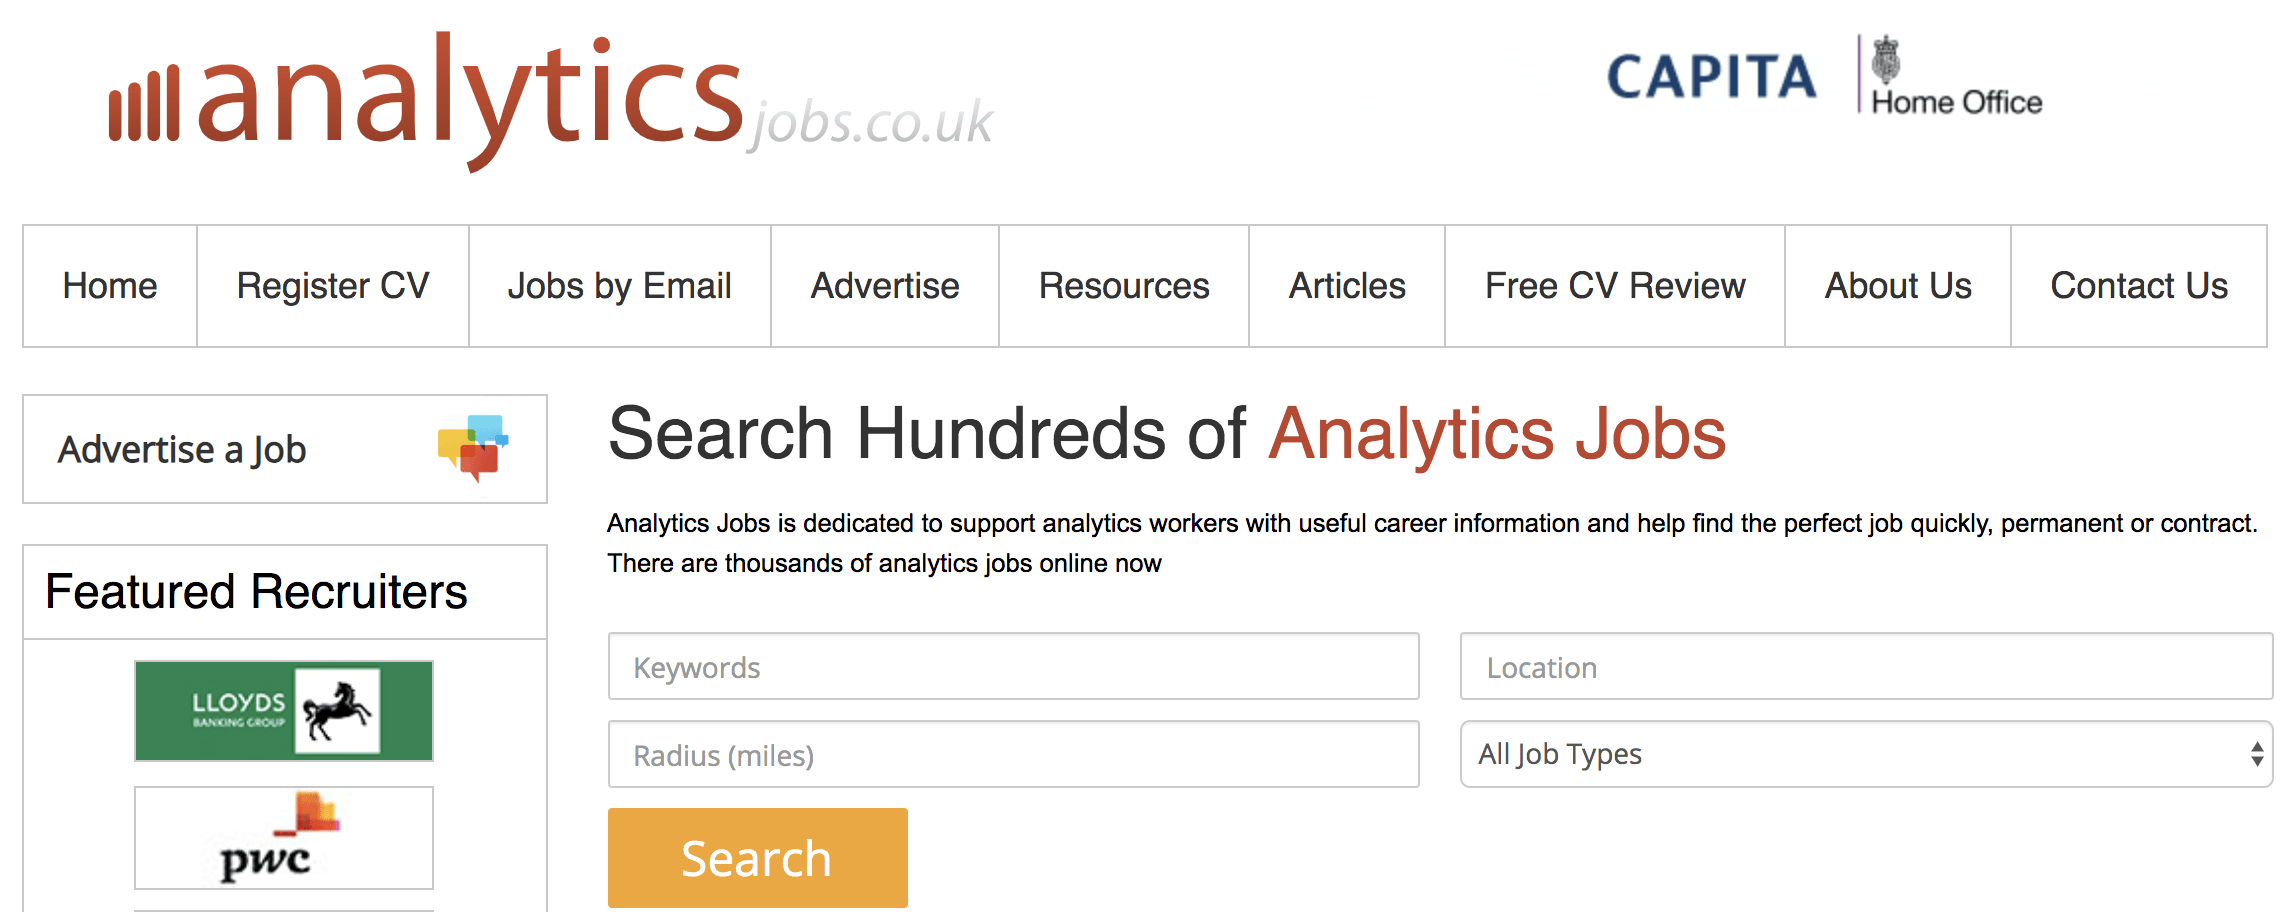
Analytics Jobs hosts job postings that are related to analytics. So you don’t have to waste time filtering your searches or hunting down relevant vacancies. However, this job board is dedicated to big-data vacancies in the United Kingdom. Owned and operated by Technojobs Group for over 20 years, it’s a source of useful career and training information to keep you up to date with industry trends and requirements. Finding the appropriate listing is as easy as clicking the relevant category on the left sidebar.
7. Leetcode
Leetcode, similar to HackeRank and InterviewBit, is a website where you can practice your coding skills by completing coding challenges. This is a great place to brush up on sorting algorithms and SQL. They’ve also included a new feature where you can practice mock interviews! Overall, I highly recommend you use this to help you prepare for your technical interviews.
8. Jumpstart

Jumpstart is a really neat resource that I only came across recently through a friend. Think of it like Reddit, but for tech jobs. While primarily used as a forum, they also have their own job board and have a calendar full of various tech events that you can sign up for!
9. Kaggle
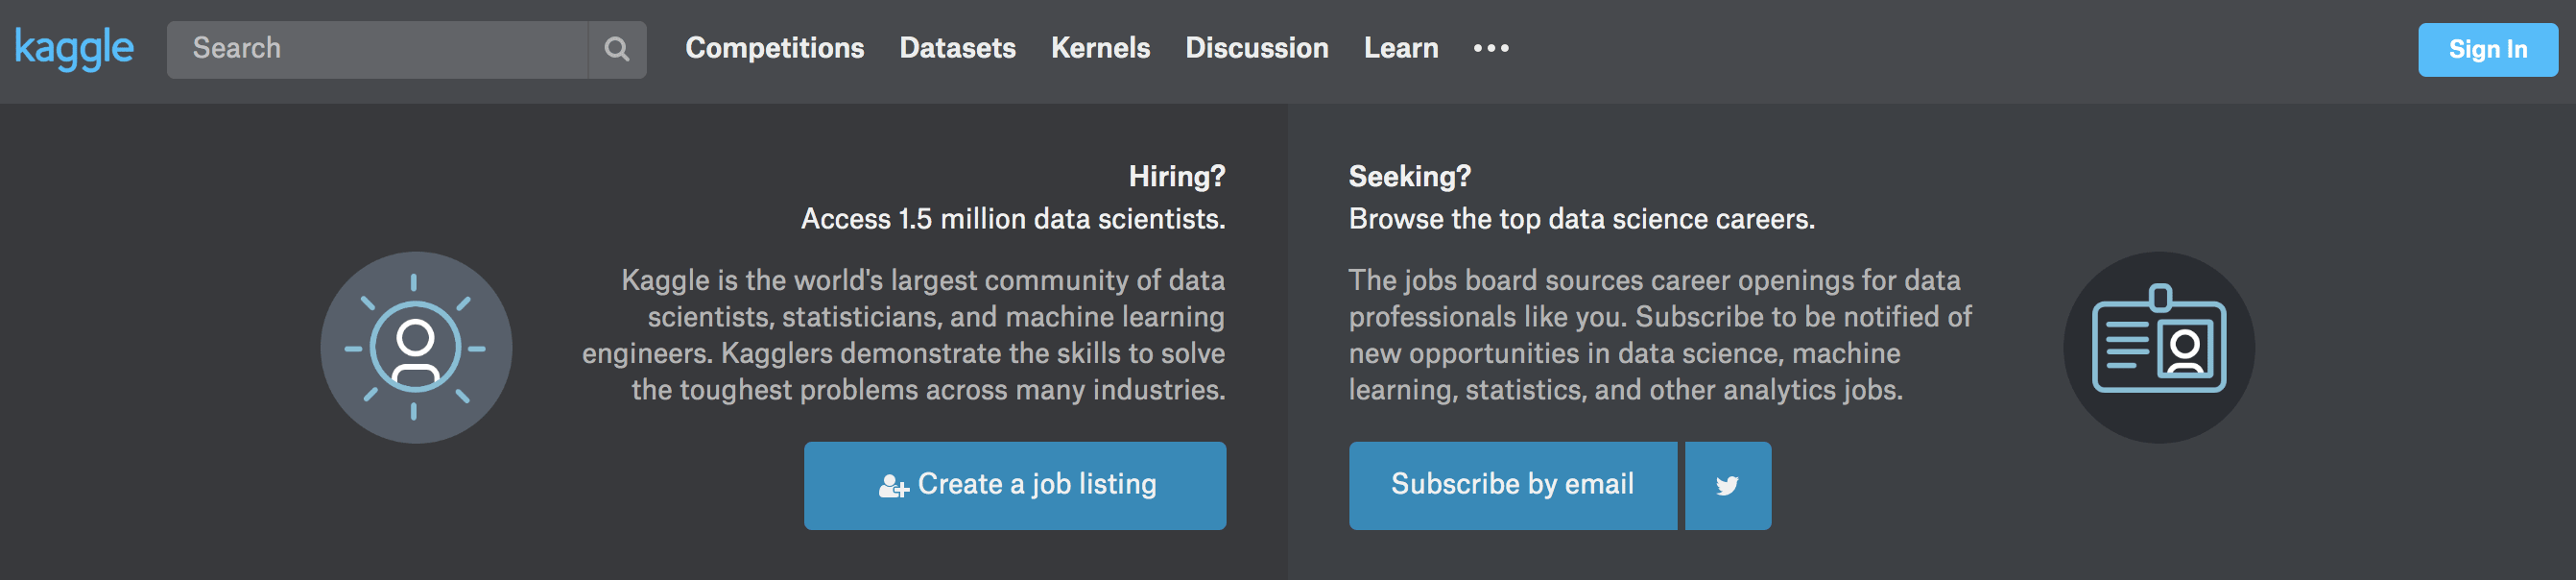
Kaggle boasts one of the world’s largest communities of data scientists, machine learning engineers, and statisticians. Members can subscribe to the latest updates on job openings and post their own vacancies. You can filter your results based on role, salary, and experience level. You can find top-ranked global companies like Amazon, Facebook, Google, and Microsoft posting their job openings here. So it might serve you well to join this community of data professionals.
10. Glassdoor
Yes, I know Glassdoor is a job board. But personally, I never really used it for that purpose. Instead, I like to use it for its unique features like the ability to see company reviews and interview questions for a plethora of companies. If you’re applying for companies that you’ve never heard of, take advantage of this and know what you’re getting yourself into. And if you want to get a better idea of a company’s interview process, this is a great resource too.
Every reader contribution, however big or small, is so valuable for our future. Support pyoflife.com from as little as $1 – and it only takes a minute. Thank you.