Books

R for College Mathematics and Statistics

In today’s digital era, data analysis is crucial in various fields, including college-level mathematics and statistics. With the advancement of technology, tools like R have become instrumental in handling complex data sets and performing statistical analyses. This article explores the significance of R in college mathematics and statistics, highlighting its capabilities and benefits.

1. Understanding the Basics of R

1.1 What is R?

R is a programming language specifically designed for statistical computing and graphics. It provides a wide range of tools and libraries that enable efficient data analysis, modeling, and visualization. Developed by statisticians, R has gained immense popularity among researchers, data analysts, and educators due to its flexibility and extensive capabilities.

1.2 Why is R essential for college mathematics and statistics?

R offers a comprehensive platform for students and educators to explore and apply mathematical and statistical concepts. Its open-source nature allows easy accessibility, making it an ideal choice for college-level courses. By using R, students can gain hands-on experience in analyzing real-world data, enhancing their understanding of mathematical and statistical principles.

R for College Mathematics and Statistics

2. R’s Data Manipulation and Visualization Features

2.1 Data Manipulation with R

R provides powerful data manipulation capabilities through libraries like dplyr and tidyverse. These libraries offer functions for filtering, transforming, and summarizing data, allowing students to clean and preprocess datasets efficiently. With R’s intuitive syntax, students can perform complex data operations effortlessly.

2.2 Data Visualization using R

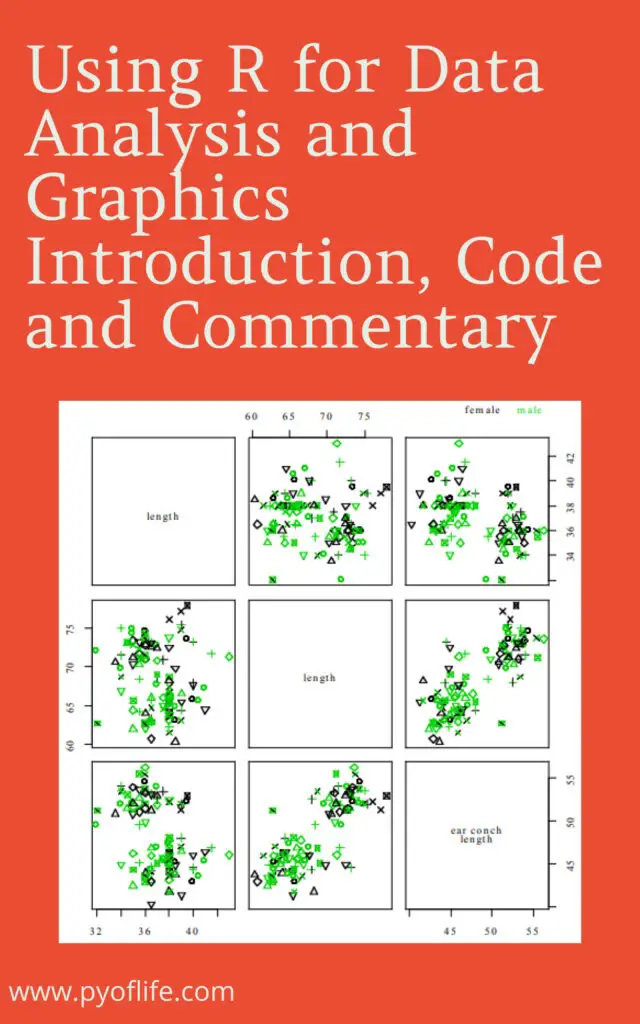
Visualization is a crucial aspect of data analysis, aiding in the interpretation and communication of findings. R provides several libraries, such as ggplot2, that enable the creation of compelling and insightful visualizations. Students can generate various types of plots, charts, and graphs to explore patterns, relationships, and distributions within the data.

3. Statistical Analysis with R

3.1 Descriptive Statistics with R

R offers a wide range of functions for descriptive statistics, allowing students to calculate measures like mean, median, standard deviation, and correlation coefficients. These statistical measures provide a summary of the data and help students understand its central tendencies and variability.

3.2 Inferential Statistics Using R

Inferential statistics involves making predictions or inferences about a population based on sample data. R provides numerous statistical tests and models for hypothesis testing, regression analysis, analysis of variance (ANOVA), and more. Students can leverage these tools to gain insights from data and make informed decisions.

4. Integrating R into College Courses

4.1 Incorporating R in Mathematics Classes

By integrating R into mathematics classes, educators can create a dynamic learning environment that promotes active engagement and practical application of mathematical concepts. Students can explore mathematical models, simulate scenarios, and analyze data using R, fostering a deeper understanding of mathematical principles.

4.2 R in Statistics Education

Statistics education can greatly benefit from incorporating R as a tool for data analysis and statistical modeling. R’s vast array of statistical functions and visualization capabilities enable students to explore real-world datasets, perform hypothesis testing, and create statistical models. This hands-on approach enhances students’ statistical reasoning and problem-solving skills.

5. Benefits of Using R in College Mathematics and Statistics

5.1 Enhanced Learning Experience

Using R in college mathematics and statistics courses provides students with a practical and immersive learning experience. They can apply theoretical concepts to real data, gaining a deeper understanding of mathematical and statistical principles in action. This active learning approach fosters critical thinking and problem-solving skills.

5.2 Real-world Applications

R is widely used in various industries for data analysis and statistical modeling. By learning R in college, students acquire a valuable skill set that is in high demand in the job market. The ability to analyze and interpret data using R opens doors to career opportunities in fields such as data science, market research, finance, and more.

5.3 Career Opportunities

Proficiency in R can significantly enhance students’ career prospects. Many organizations require professionals who can effectively handle data, perform statistical analyses, and communicate insights. With R expertise, students can pursue careers as data analysts, statisticians, and research scientists, or even pursue further studies in the field of data science.

6. Conclusion

R is an invaluable tool for college-level mathematics and statistics. Its extensive capabilities in data manipulation, visualization, and statistical analysis empower students to explore mathematical and statistical concepts in a practical and engaging manner. By integrating R into college courses, educators can equip students with the skills and knowledge needed to excel in data-driven fields.

FAQs

Q1: Is R difficult to learn for beginners?

Learning R can be challenging initially, especially for those with no prior programming experience. However, with practice and dedication, beginners can grasp its fundamentals and gradually build their proficiency. Many online resources, tutorials, and communities are available to support the learning process.

Q2: Can R handle large datasets?

Yes, R is capable of handling large datasets through various optimization techniques and packages specifically designed for efficient memory management. With proper coding practices, R can efficiently process and analyze datasets of substantial size.

Q3: Are there alternatives to R for statistical analysis?

Yes, there are alternative programming languages and tools for statistical analysis, such as Python, SAS, and SPSS. However, R’s extensive library ecosystem and its popularity among statisticians and researchers make it a preferred choice for many in the field.

Q4: Can I use R on different operating systems?

Yes, R is compatible with major operating systems like Windows, macOS, and Linux. It provides consistent functionality across platforms, allowing users to seamlessly work with R on their preferred operating system.

Q5: Is R only useful for mathematics and statistics?

While R has its roots in mathematics and statistics, it has evolved into a versatile tool used in various disciplines. R is widely employed in fields like data science, bioinformatics, finance, social sciences, and more. Its flexibility and extensive libraries make it applicable to diverse domains.

Introduction to Statistics Through Resampling Methods and R

Introduction to Statistics Through Resampling Methods and R: Statistics is a fundamental branch of mathematics that plays a crucial role in various fields, including science, business, and social sciences. It involves the collection, analysis, interpretation, presentation, and organization of data to gain meaningful insights. One approach to understanding statistics is through resampling methods, a powerful technique that allows for data analysis and inference. In this article, we will explore the statistics through resampling methods and R.

What is Statistics?

Statistics is the study of data collection, analysis, interpretation, and presentation. It involves techniques for summarizing and organizing data to extract meaningful information. By applying statistical methods, we can make informed decisions, draw conclusions, and evaluate the reliability of our findings.

Introduction to Statistics Through Resampling Methods and R

Download:

The Importance of Resampling Methods

Resampling methods are a powerful tool in statistics that allows us to make inferences about populations based on a sample. They provide a framework for estimating population parameters, assessing the uncertainty of our estimates, and testing hypotheses.

Traditional statistical methods often rely on assumptions about the data, such as the normality of the distribution or independence of observations. Resampling methods, on the other hand, make fewer assumptions and are more robust to violations of these assumptions. They provide a flexible and reliable approach to statistical analysis, especially when dealing with complex and non-standard data.

Understanding Resampling Methods

Resampling methods involve creating new samples by drawing observations from the original data. These samples are then used to estimate population parameters or evaluate the performance of statistical models. By repeatedly sampling from the data, we can generate a distribution of statistics, allowing us to quantify uncertainty and make statistical inferences.

Types of Resampling Methods

Bootstrap Sampling

Bootstrap sampling is a resampling technique that involves drawing samples with replacements from the original data. It allows us to estimate the sampling distribution of a statistic or construct confidence intervals. By repeatedly resampling the data, we can generate thousands of bootstrap samples and calculate the desired statistic for each sample. The distribution of these statistics provides valuable information about the population parameter of interest.

Cross-Validation

Cross-validation is another resampling method commonly used in predictive modeling and model selection. It involves dividing the data into multiple subsets or folds. The model is trained on a subset of the data and evaluated on the remaining fold. This process is repeated for each fold, and the performance measures are averaged to provide an estimate of the model’s generalization error. Cross-validation helps assess how well a model will perform on new, unseen data.

Introduction to R

R is a widely used statistical programming language and software environment for data analysis and visualization. It provides a rich set of tools and packages specifically designed for statistical computing. R’s versatility and extensive library of packages make it an ideal choice for implementing resampling methods and conducting statistical analyses.

Implementing Resampling Methods in R

Bootstrap Sampling in R

To perform bootstrap sampling in R, we can use the bootstrap package. This package provides functions for generating bootstrap samples and estimating statistics. By specifying the desired statistic and the number of bootstrap iterations, we can obtain the bootstrap distribution and calculate confidence intervals.

Cross-Validation in R

R also offers various packages, such as caret and rsample, that facilitate cross-validation. These packages provide functions for splitting data into folds, training models, and evaluating performance measures. By applying cross-validation techniques, we can assess the predictive accuracy of different models and select the best one for our data.

Benefits of Resampling Methods

Resampling methods offer several advantages over traditional statistical techniques:

  1. Robustness: Resampling methods are less sensitive to violations of assumptions, making them suitable for analyzing complex and non-standard data.
  2. Flexibility: Resampling methods can be applied to a wide range of statistical problems, including estimation, hypothesis testing, and model selection.
  3. Uncertainty Quantification: Resampling methods provide estimates of uncertainty through the generation of bootstrap distributions or cross-validated performance measures.
  4. Model Assessment: Resampling methods allow for the evaluation of model performance and comparison of different models, enabling data-driven decision-making.

Applications of Resampling Methods

Resampling methods find applications in various domains, including:

  • Medicine and Healthcare: Assessing treatment effectiveness, estimating survival rates, and evaluating diagnostic tests.
  • Finance and Economics: Estimating risk measures, simulating financial scenarios, and analyzing economic indicators.
  • Environmental Science: Studying biodiversity, analyzing climate data, and predicting species distribution.
  • Machine Learning: Evaluating model performance, selecting hyperparameters, and handling imbalanced datasets.

Conclusion

In conclusion, resampling methods provide a valuable approach to statistical analysis by allowing us to make inferences, quantify uncertainty, and evaluate models. Through techniques like bootstrap sampling and cross-validation, we can overcome the limitations of traditional methods and obtain robust and reliable results. By harnessing the power of statistical programming languages like R, researchers, and practitioners can implement resampling methods effectively and gain deeper insights from their data.

FAQs (Frequently Asked Questions)

  1. What are the advantages of using resampling methods in statistics? Resampling methods offer robustness, flexibility, uncertainty quantification, and model assessment, making them suitable for analyzing complex data and making data-driven decisions.
  2. How does bootstrap sampling work? Bootstrap sampling involves drawing samples with replacements from the original data to estimate population parameters or construct confidence intervals.
  3. What is cross-validation used for in statistics? Cross-validation is a resampling technique used for model evaluation and selection. It helps estimate a model’s generalization error and assess its performance on unseen data.
  4. What is R, and why is it popular in statistics? R is a statistical programming language and software environment that provides extensive tools and packages for data analysis. It is popular due to its versatility, rich visualization capabilities, and active community support.
  5. What are some real-world applications of resampling methods? Resampling methods find applications in diverse fields such as medicine, finance, environmental science, and machine learning. They are used for assessing treatment effectiveness, estimating risk measures, analyzing climate data, and evaluating model performance.

Download(PDF)

Practical Time Series Forecasting with R: A Hands-On Guide

Practical Time Series Forecasting with R: Time series forecasting is a valuable technique used to predict future values based on historical patterns in sequential data. It has numerous applications in various industries such as finance, supply chain management, healthcare, and weather forecasting. This article serves as a comprehensive guide to practical time series forecasting with R, providing step-by-step instructions and hands-on examples.

1. Introduction to Time Series Forecasting

Definition and Importance of Time Series Forecasting

Time series forecasting involves analyzing and predicting future values based on patterns observed in historical data. It helps businesses and organizations make informed decisions by providing insights into future trends, identifying anomalies, and enabling proactive planning.

Applications of Time Series Forecasting

Time series forecasting finds applications in various domains, including:

  • Financial Forecasting: Predicting stock prices, exchange rates, and market trends.
  • Demand Forecasting: Estimating future product demand for inventory management and production planning.
  • Energy Load Forecasting: Predicting electricity consumption to optimize energy generation and distribution.
  • Weather Forecasting: Forecasting temperature, rainfall, and other weather parameters for planning agricultural activities and disaster management.
Practical Time Series Forecasting with R A Hands-On Guide
Practical Time Series Forecasting with R: A Hands-On Guide

Download:

2. Understanding Time Series Data

Components of Time Series

A time series typically comprises three main components:

  • Trend: Long-term upward or downward movement in the data.
  • Seasonality: Regular patterns or fluctuations that occur within a fixed time period.
  • Residuals: Random variations or noise that cannot be attributed to trends or seasonality.

Understanding these components is crucial for accurate forecasting and identifying the appropriate models for analysis.

3. Preparing Time Series Data in R

To begin the time series forecasting process, we need to prepare the data in R. This involves importing the time series data, handling missing values, and resampling or aggregating the data if necessary.

Importing Time Series Data

R provides various libraries and functions to import time series data from different file formats such as CSV, Excel, or databases. The data should be structured with a timestamp column and the corresponding values.

Handling Missing Values

Missing values can affect the accuracy of time series forecasting models. In R, we can handle missing values by imputing them using techniques like interpolation or using specialized functions designed for time series data.

Resampling and Aggregating Time Series Data

Sometimes, the time series data may have a high frequency, such as hourly or daily observations. In such cases, it might be necessary to resample or aggregate the data into a lower frequency, such as weekly or monthly, to remove noise and focus on the underlying patterns.

4. Exploratory Data Analysis (EDA) for Time Series

Exploratory Data Analysis (EDA) helps us gain insights into the time series data, identify patterns, detect anomalies, and understand the overall structure of the data. Some common techniques for EDA in time series analysis include:

Visualizing Time Series Data

Visualizations such as line plots, scatter plots, and seasonal decomposition plots provide a graphical representation of the time series data. These visualizations help us identify trends, seasonality, and outliers.

Identifying Patterns and Anomalies

By analyzing the data visually and statistically, we can identify patterns such as upward or downward trends, cyclic patterns, or sudden spikes. Detecting anomalies is essential as they may affect the accuracy of the forecasting models.

Decomposing Time Series

Decomposing a time series involves separating the different components, namely trend, seasonality, and residuals. This decomposition allows us to analyze and model each component individually, leading to more accurate forecasts.

5. Choosing and Building Time Series Forecasting Models

When it comes to time series forecasting, several models are available, ranging from traditional statistical models to advanced machine learning algorithms. The choice of model depends on the characteristics of the data and the forecasting task at hand.

Statistical Models: ARIMA, SARIMA

ARIMA (Autoregressive Integrated Moving Average) and SARIMA (Seasonal ARIMA) are widely used statistical models for time series forecasting. They consider the autoregressive and moving average components along with the integration of differencing to handle non-stationary data.

Machine Learning Models: LSTM, XGBoost

Machine learning models, such as Long Short-Term Memory (LSTM) and XGBoost, have gained popularity in time series forecasting. LSTMs are a type of recurrent neural network that can capture long-term dependencies in sequential data, while XGBoost is an ensemble learning algorithm known for its robust performance.

Ensemble Approaches

Ensemble approaches combine the predictions from multiple models to improve forecasting accuracy. Techniques like model averaging, weighted averaging, or stacking can be used to create an ensemble of models.

6. Evaluating Time Series Forecasting Models

To assess the performance of time series forecasting models, it is essential to split the data into training and testing sets. The testing set represents the future period for which we want to evaluate the forecasts. Various performance metrics can be used, including:

  • Root Mean Squared Error (RMSE): Measures the average difference between predicted and actual values.
  • Mean Absolute Error (MAE): Provides the average absolute difference between predicted and actual values.
  • Mean Absolute Percentage Error (MAPE): Calculates the percentage difference between predicted and actual values.

Visualizations, such as line plots comparing forecasts and actual values, also help in understanding the accuracy of the models.

7. Time Series Forecasting with R

R is a powerful programming language for statistical computing and data analysis, widely used for time series forecasting. Let’s explore how to build some popular time series forecasting models in R.

Building ARIMA Model in R

In R, we can use the forecast package to build ARIMA models. This package provides functions like auto.arima for automated model selection and forecast for generating forecasts.

Building SARIMA Model in R

For time series data with seasonality, SARIMA models are more appropriate. In R, the forecast package also supports SARIMA modeling using functions like auto.arima.

Building LSTM Model in R

To build LSTM models in R, we can use libraries such as keras or tensorflow. These libraries provide APIs to create, train, and evaluate LSTM models.

Building XGBoost Model in R

XGBoost is a popular machine-learning algorithm for time series forecasting. In R, we can use the xgboost library to build XGBoost models. The library offers functions for training and predicting with XGBoost models.

8. Fine-tuning and Improving Time Series Models

Fine-tuning time series models involves optimizing the model parameters, selecting the appropriate model based on evaluation metrics, and incorporating feature engineering techniques.

Parameter Optimization

By tuning the hyperparameters of the models, such as the order of differencing in ARIMA or the number of hidden units in LSTM, we can improve the accuracy of the forecasts.

Model Selection and Validation

It is essential to compare the performance of different models and select the one with the best accuracy. Cross-validation techniques like k-fold cross-validation can help in assessing the generalization capability of the models.

Feature Engineering

Feature engineering involves creating additional features from the existing data to improve model performance. Techniques like lag variables, moving averages, or seasonal indicators can provide additional information to the models.

9. Implementing Time Series Forecasting in Real-Life Scenarios

Time series forecasting has practical applications in various industries. Let’s explore a few scenarios where time series forecasting with R can be implemented:

Demand Forecasting

For businesses dealing with inventory management and supply chains, accurate demand forecasting is crucial. Time series forecasting models can be used to predict future product demand based on historical sales data, enabling efficient inventory management.

Stock Market Prediction

Time series forecasting plays a significant role in stock market prediction. By analyzing historical stock prices and market data, models can provide insights into future trends and help investors make informed decisions.

Energy Load Forecasting

Predicting electricity consumption is essential for efficient energy generation and distribution. Time series forecasting models can analyze historical energy load data and generate forecasts, enabling utilities to optimize energy resources.

10. Conclusion

Time series forecasting is a powerful tool for predicting future values based on historical patterns in sequential data. In this hands-on guide, we explored the fundamentals of time series forecasting, data preparation in R, model selection and building, model evaluation, and real-life applications.

By leveraging statistical models like ARIMA and SARIMA, as well as machine learning models like LSTM and XGBoost, businesses and organizations can make accurate predictions and gain valuable insights. R provides a robust ecosystem for time series forecasting, making it a preferred choice for data analysts and researchers.

To delve deeper into practical time series forecasting with R, further exploration and experimentation with different datasets and models are highly encouraged.


FAQs

  1. Is time series forecasting only applicable to financial data?
    • No, time series forecasting has applications in various domains beyond finance, such as demand forecasting, weather forecasting, and energy load forecasting.
  2. Can I use machine learning models for time series forecasting?
    • Yes, machine learning models like LSTM and XGBoost can be effective for time series forecasting tasks, especially when there are complex patterns and long-term dependencies.
  3. How can I evaluate the accuracy of time series forecasting models?
    • Performance metrics such as RMSE, MAE, and MAPE are commonly used to evaluate the accuracy of time series forecasting models. Visual comparisons between predicted and actual values also provide insights.
  4. Can I implement time series forecasting in real-life scenarios?
    • Absolutely! Time series forecasting has practical applications in demand forecasting, stock market prediction, energy load forecasting, and more. Implementing these techniques can help optimize business operations.
  5. Where can I learn more about time series forecasting with R?
    • There are numerous online resources, tutorials, and books available on time series forecasting with R. You can also explore R’s official documentation and community forums for additional guidance.

Download (PDF)

Learn Data Analysis with Python Lessons in Coding

Learn Data Analysis with Python Lessons in Coding: Data analysis is a crucial skill in today’s data-driven world. Python, with its powerful libraries and frameworks, has become the go-to programming language for data analysis tasks. Whether you’re a beginner or an experienced programmer, this article will guide you through the process of learning data analysis with Python. From the basics of Python programming to advanced data manipulation techniques, statistical analysis, and visualization, you’ll gain the knowledge and skills necessary to become proficient in data analysis using Python.

1. What is Data Analysis?

Data analysis is the process of inspecting, cleaning, transforming, and modeling data to uncover useful information, draw conclusions, and support decision-making. It involves various techniques, such as data manipulation, visualization, and statistical analysis, to gain insights from structured or unstructured data. Data analysis plays a vital role in numerous domains, including business, finance, healthcare, marketing, and social sciences.

Learn Data Analysis with Python Lessons in Coding

2. Why Learn Data Analysis with Python?

Python has gained immense popularity among data analysts due to its simplicity, versatility, and rich ecosystem of libraries and frameworks specifically designed for data analysis. Learning data analysis with Python offers several advantages:

  • Ease of Use: Python has a clean and readable syntax, making it easier to learn and understand for beginners.
  • Powerful Libraries: Python provides a wide range of libraries such as NumPy, Pandas, Matplotlib, and Scikit-learn that simplify complex data analysis tasks.
  • Community Support: Python has a vast and active community of data analysts and developers who provide support and contribute to the development of data analysis tools.
  • Integration with Other Technologies: Python seamlessly integrates with other technologies, allowing data analysts to incorporate their analysis into web applications, databases, and more.

3. Getting Started with Python

Before diving into data analysis, it’s essential to familiarize yourself with the basics of Python programming. Here are a few steps to get started:

  1. Install Python: Visit the official Python website (https://www.python.org) and download the latest version of Python for your operating system. Follow the installation instructions to set up Python on your machine.
  2. Interactive Python Interpreter: Python comes with an interactive interpreter that allows you to execute Python code line by line. Open the interpreter and start experimenting with simple Python statements and expressions.
  3. Python IDEs: Integrated Development Environments (IDEs) such as PyCharm, Spyder, and Jupyter Notebook provide a more feature-rich and convenient environment for writing and executing Python code. Choose an IDE that suits your preferences and install it.
  4. Basic Python Syntax: Learn the basic syntax of Python, including variables, data types, operators, control flow statements, functions, and classes. Understanding these fundamentals will help you write effective and efficient Python code.

4. Python Libraries for Data Analysis

Python offers a wide range of libraries specifically built for data analysis. Here are some essential libraries you should familiarize yourself with:

  • NumPy: NumPy provides efficient numerical computing capabilities in Python. It includes a powerful N-dimensional array object, mathematical functions, linear algebra operations, and random number generation.
  • Pandas: Pandas is a popular library for data manipulation and analysis. It offers data structures like DataFrame and Series, which simplify handling structured data. Pandas provide various functions for filtering, grouping, reshaping, and merging data.
  • Matplotlib: Matplotlib is a versatile plotting library that allows you to create a wide range of visualizations, including line plots, scatter plots, bar plots, histograms, and more. It provides extensive customization options to make your plots informative and visually appealing.
  • Scikit-learn: Scikit-learn is a comprehensive library for machine learning in Python. It offers a wide range of algorithms for classification, regression, clustering, and dimensionality reduction. Scikit-learn also provides tools for model evaluation and selection.

These libraries, along with many others, form the foundation of data analysis in Python. Learning how to effectively use these libraries will enable you to perform a wide range of data analysis tasks efficiently.

5. Data Manipulation with Pandas

Pandas is a powerful library that provides high-performance, easy-to-use data structures, and data analysis tools. It simplifies various data manipulation tasks, such as cleaning, transforming, and reshaping data. Here are some key topics to explore in Pandas:

  • Data Structures: Pandas introduces two primary data structures: Series and DataFrame. A Series represents a one-dimensional array with labeled indexes, while a DataFrame is a two-dimensional table with labeled columns and rows.
  • Data Cleaning: Pandas offers numerous functions to handle missing data, duplicate records, and outliers. You can use functions like dropna(), fillna(), drop_duplicates(), and more to clean your data effectively.
  • Data Transformation: Pandas provides functions to transform data, including filtering rows based on conditions, selecting specific columns, applying functions to data, and merging multiple datasets.
  • Data Aggregation: Pandas allows you to aggregate data using functions like groupby(), pivot_table(), and resample(). These functions help summarize data based on specific criteria, such as calculating mean, sum, count, etc.

6. Exploratory Data Analysis

Exploratory Data Analysis (EDA) is a crucial step in data analysis that involves understanding the data, identifying patterns, and extracting insights. Here are some techniques commonly used in EDA:

  • Descriptive Statistics: Descriptive statistics provide summary statistics such as mean, median, standard deviation, and quartiles. Pandas’ describe() function is useful for generating descriptive statistics for numerical columns.
  • Data Visualization: Visualizing data helps identify trends, outliers, and relationships between variables. Matplotlib and Seaborn libraries provide a wide range of plots, including scatter plots, histograms, box plots, and more.
  • Correlation Analysis: Correlation analysis measures the relationship between variables. Pandas’ corr() function calculates the correlation coefficient between columns, and heatmaps can be used to visualize correlations.
  • Hypothesis Testing: Hypothesis testing allows you to test the significance of observations or relationships in your data. Python’s scipy.stats module provides various statistical tests, such as t-tests and chi-square tests.

7. Data Visualization with Matplotlib

Data visualization is a powerful tool for effectively communicating insights and patterns in your data. Matplotlib provides a comprehensive set of functions for creating various types of plots. Here are some popular plot types:

  • Scatter Plots: Scatter plots are used to identify relationships and patterns between two continuous variables. Matplotlib’s scatter() function allows you to create scatter plots with customizable markers and colors.
  • Bar Plots: Bar plots are effective for comparing categorical variables or displaying frequency distributions. Matplotlib’s bar() and barh() functions can be used to create vertical and horizontal bar plots, respectively.
  • Histograms: Histograms show the distribution of a single variable. Matplotlib’s hist() function allows you to create histograms with adjustable bin sizes and styles.
  • Line Plots: Line plots are useful for visualizing trends over time or continuous variables. Matplotlib’s plot() function is commonly used to create line plots.

8. Statistical Analysis with Python

Python provides a wide range of libraries for statistical analysis. These libraries offer functions and methods to perform statistical tests, model fitting, and inference. Some essential libraries for statistical analysis include:

  • SciPy: SciPy is a library that provides functions for scientific computing and statistical analysis. It includes modules for optimization, integration, interpolation, signal processing, and more.
  • StatsModels: StatsModels is a Python library that specializes in statistical modeling, including linear regression, generalized linear models, time series analysis, and more. It also provides tools for statistical tests and diagnostics.
  • PyMC3: PyMC3 is a probabilistic programming library that allows you to perform Bayesian statistical modeling and inference. It provides a high-level syntax for specifying models and efficient algorithms for model fitting.

These libraries enable you to perform a wide range of statistical analyses, from basic hypothesis testing to advanced modeling techniques.

9. Machine Learning for Data Analysis

Machine learning is a subset of artificial intelligence that enables systems to learn and make predictions or decisions based on data. Python provides powerful libraries for machine learning, making it a popular choice for data analysts. Some essential machine learning libraries in Python are:

  • Scikit-learn: Scikit-learn is a comprehensive library for machine learning tasks. It includes algorithms for classification, regression, clustering, dimensionality reduction, and more. Scikit-learn also provides utilities for data preprocessing, model evaluation, and model selection.
  • TensorFlow: TensorFlow is an open-source library for machine learning and deep learning. It allows you to build and train neural networks for various tasks, such as image classification, natural language processing, and time series analysis.
  • Keras: Keras is a high-level neural networks API that runs on top of TensorFlow. It simplifies the process of building and training deep learning models, making it more accessible to beginners.

With these libraries, you can apply machine learning algorithms to your data and make predictions or uncover patterns and insights.

10. Web Scraping and Data Analysis

Web scraping is the process of automatically extracting data from websites. Python provides several libraries for web scraping, such as BeautifulSoup and Scrapy. Here’s how you can combine web scraping and data analysis:

  1. Identify Target Websites: Determine the websites that contain the data you need for your analysis. Look for websites that have publicly accessible data or APIs.
  2. Web Scraping Tools: Choose a web scraping library like BeautifulSoup or Scrapy, depending on your requirements. These libraries provide functions and methods to extract data from HTML or web APIs.
  3. Data Extraction: Use the web scraping library to extract the desired data from the target websites. Parse the HTML structure, find relevant elements, and extract the data into a structured format like CSV or JSON.
  4. Data Analysis: Once you have the extracted data, you can perform various data analysis tasks using Python libraries like Pandas, NumPy, and Matplotlib. Clean the data, perform exploratory analysis, and draw meaningful insights.

11. Time Series Analysis with Python

Time series analysis involves analyzing and modeling data that is collected over a series of time intervals. Python provides powerful libraries for time series analysis, such as Pandas and StatsModels. Here are some key steps in time series analysis:

  1. Import Time Series Data: Load the time series data into Python, ensuring that the data is in a suitable format such as CSV or Excel.
  2. Data Preprocessing: Preprocess the time series data by handling missing values, handling outliers, and converting the data into a time series object.
  3. Visualize Time Series Data: Use libraries like Matplotlib or Seaborn to plot the time series data. Identify any trends, seasonality, or patterns in the data.
  4. Time Series Modeling: Apply time series models such as Autoregressive Integrated Moving Average (ARIMA) or Seasonal ARIMA (SARIMA) to the data. Use libraries like StatsModels or Prophet for model fitting and forecasting.
  5. Evaluate and Validate Models: Evaluate the performance of your time series models using evaluation metrics like mean squared error (MSE) or mean absolute error (MAE). Validate the models by comparing forecasted values with actual values.

12. Natural Language Processing

Natural Language Processing (NLP) involves analyzing and understanding human language using computational methods. Python provides powerful libraries for NLP, such as NLTK (Natural Language Toolkit) and SpaCy. Here are some key aspects of NLP:

  • Tokenization: Tokenization is the process of breaking text into individual words or sentences. Python libraries like NLTK and SpaCy provide functions for tokenizing text.
  • Text Preprocessing: Text preprocessing involves tasks like removing stop words, stemming or lemmatization, and handling special characters. These tasks help clean and normalize text data before further analysis.
  • Named Entity Recognition: Named Entity Recognition (NER) identifies and classifies named entities in text, such as names, organizations, locations, and dates. SpaCy provides robust NER capabilities.
  • Sentiment Analysis: Sentiment analysis determines the sentiment or opinion expressed in text. It helps understand the sentiment of customers, users, or social media users. Libraries like NLTK and TextBlob offer pre-trained sentiment analysis models.

13. Big Data Analysis with Python

Python is a versatile language that can handle big data analysis using various frameworks and libraries. Some popular options for big data analysis with Python are:

  • Apache Spark: Apache Spark is a distributed computing framework that provides high-level APIs for big data processing. It integrates well with Python through the PySpark library, enabling scalable data analysis.
  • Dask: Dask is a flexible library that provides parallel computing capabilities for tasks involving big data. It seamlessly integrates with Pandas and other Python libraries, allowing you to scale your data analysis workflows.
  • Hadoop: Hadoop is an open-source framework that allows distributed storage and processing of large datasets. Python can interact with Hadoop through libraries like Hadoop Streaming or Pydoop.

These frameworks enable you to work with large datasets and perform distributed data analysis efficiently.

14. Data Analysis Case Studies

To gain a deeper understanding of data analysis with Python, it’s helpful to explore real-world case studies. Here are a few examples:

  1. E-commerce Sales Analysis: Analyzing sales data from an e-commerce platform to identify trends, popular products, and customer segmentation.
  2. Social Media Sentiment Analysis: Analyzing social media data to understand public sentiment towards a particular product, brand, or event.
  3. Stock Market Analysis: Analyzing historical stock market data to identify patterns, predict trends, and develop trading strategies.
  4. Customer Churn Analysis: Analyzing customer data to identify factors that contribute to customer churn and develop retention strategies.

By studying these case studies, you’ll learn practical techniques for solving real-world data analysis problems using Python.

15. Resources for Further Learning

To continue your journey in learning data analysis with Python, here are some valuable resources:

  • Online Courses: Platforms like Coursera, edX, and DataCamp offer online courses specifically focused on data analysis with Python. These courses provide structured learning paths and hands-on projects.
  • Documentation and Tutorials: Explore the official documentation and tutorials of Python libraries like Pandas, NumPy, and Matplotlib. These resources provide in-depth explanations and examples.
  • Online Communities: Join online communities like Stack Overflow, Reddit, and Data Science forums to ask questions, share insights, and learn from other data analysts.
  • Books: There are several excellent books available on data analysis with Python, such as “Python for Data Analysis” by Wes McKinney and “Data Science Handbook” by Jake VanderPlas. These books provide comprehensive coverage of various data analysis topics.

Remember to practice regularly and apply your learnings to real-world projects to strengthen your skills and gain practical experience.

Frequently Asked Questions (FAQs):

Q: How long does it take to learn data analysis with Python? A: The time required to learn data analysis with Python depends on various factors, including your prior programming experience, the amount of time you dedicate to learning, and the complexity of the projects you undertake. With consistent effort and practice, you can start performing basic data analysis tasks within a few weeks and gradually progress to more advanced techniques over time.

Q: Do I need a background in statistics to learn data analysis with Python? A: While having a basic understanding of statistics can be helpful, it is not a prerequisite for learning data analysis with Python. Python libraries like Pandas and NumPy provide functions for statistical calculations, and there are resources available that explain statistical concepts in the context of data analysis using Python.

Q: Can I use Python for big data analysis? A: Yes, Python can be used for big data analysis. Libraries like Apache Spark and Dask allow you to process and analyze large datasets using Python. These frameworks provide distributed computing capabilities, enabling you to scale your data analysis workflows.

Q: What career opportunities are available for data analysts proficient in Python? A: Proficiency in data analysis with Python opens up various career opportunities. You can pursue roles such as Data Analyst, Business Analyst, Data Scientist, Data Engineer, or Machine Learning Engineer. Industries like finance, healthcare, e-commerce, and marketing heavily rely on data analysis, offering a wide range of career prospects.

Q: Are there any certifications for data analysis with Python? A: Yes, there are several certifications available for data analysis with Python. Organizations like Coursera, edX, and DataCamp offer certification programs that validate your skills and knowledge in data analysis. Additionally, certifications from recognized bodies like Microsoft, IBM, or SAS can add credibility to your profile.

Q: How can I showcase my data analysis projects to potential employers? A: Building a portfolio of data analysis projects is an effective way to showcase your skills to potential employers. Create a GitHub repository or personal website where you can share the code and results of your projects. Include a detailed description of each project, the data analysis techniques used, and the insights gained.

Conclusion

Learning data analysis with Python opens up exciting opportunities to extract insights and make informed decisions from data. In this article, we covered various aspects of data analysis, including Python basics, essential libraries, data manipulation, visualization, statistical analysis, machine learning, and more. By following the outlined topics and exploring additional resources, you’ll develop expertise in data analysis with Python. Start your journey today and unlock the power of data-driven insights.

Using R for Data Analysis and Graphics Introduction, Code and Commentary

Using R for Data Analysis and Graphics: In today’s data-driven world, the ability to analyze and visualize data effectively is crucial for making informed decisions. R, a powerful programming language and software environment, provides a wide range of tools and techniques for data analysis and graphics. In this article, we will explore the capabilities of R and how it can be utilized to gain valuable insights from data.

1. What is R?

R is a free and open-source programming language specifically designed for statistical computing and graphics. It provides a wide range of statistical and graphical techniques, making it a popular choice among data analysts and researchers. R has a vast collection of packages that extend its functionality, allowing users to perform complex data manipulations and advanced statistical modeling.

Using R for Data Analysis and Graphics
Download:

2. Installing R and RStudio

To get started with R, you need to install the R programming language and an integrated development environment (IDE) called RStudio. RStudio provides a user-friendly interface and additional tools that enhance the R programming experience. Both R and RStudio can be downloaded for free from their respective websites and are available for Windows, Mac, and Linux operating systems.

3. Loading and Manipulating Data

One of the first steps in data analysis is loading the data into R and preparing it for analysis. R offers various functions and packages for importing data from different file formats, such as CSV, Excel, or databases. Once the data is loaded, R provides powerful functions for manipulating and transforming the data, such as subsetting, merging, and reshaping, to suit the analysis needs.

4. Descriptive Statistics

Descriptive statistics summarize and describe the main features of a dataset. R provides a comprehensive set of functions to calculate common descriptive statistics, such as mean, median, standard deviation, and quartiles. These statistics help in understanding the central tendencies, dispersion, and distribution of the data. Additionally, R offers functions to compute correlations, perform hypothesis tests, and conduct exploratory data analysis.

5. Data Visualization with Base R Graphics

R offers a wide range of graphical functions that allow users to create visually appealing and informative plots. Base R graphics provide a flexible system for creating various types of plots, including scatter plots, line plots, bar plots, histograms, and boxplots. These plots can be customized using different colors, symbols, and labeling options to effectively communicate the patterns and relationships within the data.

6. Creating Interactive Visualizations with ggplot2

ggplot2 is a popular data visualization package in R that provides a powerful and elegant grammar of graphics. It allows users to create complex and sophisticated visualizations with minimal code. ggplot2 follows a layered approach, where users can add different graphical elements, such as data points, lines, and facets, to build up a complete visualization. It also supports interactive features, making it easier to explore and analyze the data interactively.

7. Advanced Data Analysis Techniques

R offers advanced statistical modeling techniques for analyzing complex datasets. It includes packages for linear regression, logistic regression, time series analysis, clustering, and machine learning algorithms. These techniques allow analysts to uncover hidden patterns, predict outcomes, and make data-driven decisions. R’s extensive library of packages ensures that analysts have access to cutting-edge methodologies for various analytical tasks.

8. Reporting and Presenting Results

Once the data analysis is complete, R provides tools for generating high-quality reports and presentations. Packages like knitr and rmarkdown allow users to combine code, results, and narratives in a single document. This integration enables reproducible research and makes it easier to share findings with others. RMarkdown supports various output formats, such as HTML, PDF, and Word, allowing analysts to choose the most suitable format for their audience.

Conclusion

R is a versatile programming language that empowers data analysts and researchers to perform complex data analysis and create compelling visualizations. Its rich ecosystem of packages, combined with its statistical capabilities, makes it a valuable tool for anyone working with data. By leveraging R’s power, users can gain deeper insights, uncover trends, and effectively communicate their findings to others.

FAQs

  1. Can I use R for big data analysis?
    • Yes, R has packages like dplyr and data.table that can handle large datasets efficiently.
  2. Is R suitable for machine learning?
    • Absolutely! R has several packages, such as caret and mlr, that provide a wide range of machine learning algorithms.
  3. Are there resources available to learn R?
    • Yes, there are numerous online tutorials, books, and community forums dedicated to learning R. Some popular resources include RStudio’s website, R-bloggers, and the official R documentation.
  4. Can I create interactive dashboards with R?
    • Yes, R offers packages like shiny that that allow you to build interactive web applications and dashboards.
  5. Can I integrate R with other programming languages?
    • R provides interfaces to many programming languages, including Python and C++, allowing you to leverage the strengths of multiple languages in your analysis.

Download(PDF)

Beginning Data Science with R

Beginning Data Science with R: Data science has emerged as a crucial field in today’s digital age, where vast amounts of data are generated and analyzed to gain insights and make informed decisions. Among the various programming languages used in data science, R stands out as a powerful and versatile tool. In this article, we will delve into beginning Data Science with R, exploring its key concepts, applications, and resources for beginners.

1. What is Data Science?

Data science is an interdisciplinary field that combines statistical analysis, machine learning, and domain expertise to extract insights and knowledge from structured and unstructured data. It involves collecting, cleaning, analyzing, and interpreting data to uncover patterns, make predictions, and drive decision-making processes.

Beginning Data Science with R

2. Why Choose R for Data Science?

R is a popular programming language and environment for data science due to its extensive collection of packages, statistical capabilities, and visualization tools. It offers a wide range of libraries and frameworks that simplify complex data tasks and enable efficient data manipulation, exploration, and modeling.

3. Setting Up Your R Environment

Before diving into data science with R, it’s essential to set up your environment. Start by downloading and installing R from the official website (https://www.r-project.org/). Once R is installed, consider using an integrated development environment (IDE) like RStudio, which provides a user-friendly interface and advanced features for R programming.

4. Basic Data Manipulation with R

In data science, manipulating data is a fundamental step. R provides various functions and packages for handling data frames, merging datasets, filtering, sorting, and transforming variables. Learning the basics of data manipulation in R will empower you to clean and prepare data for further analysis.

5. Exploratory Data Analysis

Exploratory Data Analysis (EDA) is a crucial phase in data science, where you gain insights and understanding of the data through visualizations and summary statistics. R offers a wide array of packages, such as ggplot2 and dplyr, which enable you to explore data, identify trends, detect outliers, and uncover relationships between variables.

6. Data Visualization with R

Visualizing data is an effective way to communicate findings and make complex information more accessible. R provides a rich ecosystem of packages, including ggplot2 and plotly, that allows you to create stunning visualizations such as scatter plots, bar charts, histograms, and interactive dashboards.

7. Statistical Analysis with R

R is widely used for statistical analysis due to its comprehensive set of statistical functions and packages. From basic descriptive statistics to advanced modeling techniques, R provides the necessary tools for hypothesis testing, regression analysis, time series analysis, and more. Mastery of statistical analysis in R is crucial for deriving meaningful insights from data.

8. Machine Learning with R

Machine learning is a core component of data science, enabling the development of predictive models and automated decision-making systems. R offers numerous machine learning packages, such as caret and randomForest, which cover many algorithms, including classification, regression, clustering, and recommendation systems.

9. R Packages for Data Science

R boasts an extensive ecosystem of packages specifically designed for data science tasks. Some popular packages include dplyr for data manipulation, ggplot2 for data visualization, tidyr for data tidying, and caret for machine learning. Familiarize yourself with these packages as they will greatly enhance your productivity and efficiency in data science projects.

10. Online Resources for Learning R

Learning R can be an exciting journey, and plenty of online resources are available to guide you along the way. Websites like DataCamp, Coursera, and Udemy offer comprehensive R courses and tutorials for beginners. Additionally, the R documentation and online forums provide valuable references and support for R users.

11. Data Science Case Studies with R

To gain practical experience and deepen your understanding of data science, it’s beneficial to explore real-world case studies. Numerous organizations and data science communities share case studies and datasets on platforms like Kaggle and GitHub. By studying these cases and replicating analyses with R, you can develop critical thinking skills and learn from established data science practices.

12. Challenges and Future of Data Science

While data science offers immense opportunities, it also comes with challenges. The field constantly evolves, requiring data scientists to stay updated with emerging technologies, ethical considerations, and legal regulations. As data volumes continue to grow exponentially, data science professionals must adapt and refine their skills to extract meaningful insights from complex datasets.

13. Conclusion

In conclusion, embarking on a journey into data science with R can be an enriching experience. R’s versatility, powerful packages, and active community make it an excellent choice for beginners. By mastering the foundations of R programming, data manipulation, exploratory analysis, and machine learning, you can unlock the potential of data science and contribute to making data-driven decisions in various domains.

Frequently Asked Questions (FAQs)

Q1: Can I use R for big data analysis? Yes, R can handle big data analysis. There are packages like dplyr, data.table, and sparklyr that allow you to process and analyze large datasets efficiently.

Q2: Is R difficult to learn for beginners? While learning any programming language requires dedication and practice, R has a relatively gentle learning curve. Its syntax is intuitive, and there are abundant learning resources available for beginners.

Q3: Can I build interactive visualizations with R? Absolutely! R offers packages like plotly and shiny, which allow you to build interactive and dynamic visualizations that can be deployed as web applications.

Q4: Is R suitable for text mining and natural language processing? Yes, R has excellent packages such as tm, tidytext, and text mining that enable text mining, sentiment analysis, and natural language processing tasks.

Q5: Are there career opportunities in data science with R? Definitely! Data science skills, including R proficiency, are in high demand across industries. Companies are seeking professionals who can derive insights from data and drive data-informed decision-making processes.

Python Data Analysis

Perform Data Collection, Data Processing, Wrangling, Visualization, and Model Building Using Python

Python has become one of the most popular programming languages for data analysis due to its versatility, ease of use, and powerful libraries. With Python, you can perform various tasks such as data collection, data processing, data wrangling, data visualization, and model building. In this article, we will explore these essential aspects of data analysis and discuss how they contribute to extracting valuable insights from data.

1. Introduction to Python Data Analysis

Python is an excellent choice for data analysis as it offers a wide range of libraries and tools specifically designed for handling and analyzing data. These libraries, such as Pandas, NumPy, Matplotlib, and Scikit-learn, provide efficient and intuitive functionalities that streamline the data analysis process.

Python Data Analysis

2. Data Collection

Data collection is the first step in any data analysis project. Python offers various techniques to collect data from different sources, including web scraping, APIs, databases, and files. By leveraging libraries like BeautifulSoup and Requests, you can extract data from websites easily. Similarly, you can connect to databases, retrieve data, and import data from files using libraries like SQLite3 and Pandas.

3. Data Processing

Once the data is collected, it often requires processing to clean, transform, and reshape it into a suitable format for analysis. Python provides powerful libraries like Pandas, which offer extensive data manipulation capabilities. You can perform operations such as filtering, sorting, merging, and aggregating data to prepare it for further analysis.

4. Data Wrangling

Data wrangling involves transforming and restructuring the data to address inconsistencies, missing values, and outliers. Python’s Pandas library provides functions and methods to handle these data issues effectively. You can remove or impute missing values, handle outliers, and convert data types using Pandas’ flexible functionalities.

5. Data Visualization

Data visualization plays a crucial role in understanding patterns, trends, and relationships within the data. Python offers several libraries, including Matplotlib, Seaborn, and Plotly, for creating insightful visualizations. These libraries provide a wide range of plot types, such as bar charts, line plots, scatter plots, and heatmaps, allowing you to represent data in a visually appealing and informative manner.

6. Model Building

Model building involves applying machine learning algorithms to analyze and predict outcomes based on the data. Python’s Scikit-learn library offers a comprehensive suite of machine learning algorithms, along with tools for model evaluation and validation. With Scikit-learn, you can build and train models for classification, regression, clustering, and more.

7. Conclusion

Python is a versatile and powerful programming language for data analysis. Its rich ecosystem of libraries and tools makes it an ideal choice for performing tasks like data collection, data processing, data wrangling, data visualization, and model building. By leveraging Python’s capabilities, you can unlock valuable insights from data and make informed decisions.

Frequently Asked Questions (FAQs)

Q1: Can I perform data analysis in Python without programming experience?

While programming experience can be beneficial, Python is known for its user-friendly syntax and intuitive libraries. With the right resources and tutorials, beginners can quickly grasp the fundamentals and start performing data analysis tasks in Python.

Q2: Which libraries are commonly used for data visualization in Python?

Python provides several libraries for data visualization, including Matplotlib, Seaborn, Plotly, and Bokeh. These libraries offer a wide range of options for creating static and interactive visualizations to effectively communicate data insights.

Q3: How does Python compare to other programming languages for data analysis?

Python has gained significant popularity in the field of data analysis due to its ease of use, extensive library support, and strong community. Compared to other programming languages, Python offers a more streamlined and productive workflow for data analysis tasks.

Q4: Is Python suitable for big data analysis?

Python can handle various scales of data analysis tasks, including big data analysis. Libraries like PySpark and Dask provide distributed computing capabilities, allowing Python to efficiently process and analyze large datasets.

Download: Introduction to Statistical Learning with Applications in Python

Statistical Analysis With R Beginner’s Guide

Statistical Analysis With R Beginner’s Guide: Are you a beginner looking to delve into the world of statistical analysis using R? Look no further! In this comprehensive guide, we will walk you through the basics of statistical analysis with R, providing you with the knowledge and tools you need to get started. Whether you are a student, researcher, or data enthusiast, this guide will equip you with the fundamental skills to analyze and interpret data effectively. So, let’s dive right in!

What is Statistical Analysis?

Statistical analysis is a branch of mathematics that involves collecting, analyzing, interpreting, and presenting data. It helps us make sense of complex datasets and draw meaningful conclusions from them. Statistical analysis provides a framework for understanding patterns, relationships, and trends within data, enabling us to make informed decisions and predictions.

Statistical Analysis With R Beginner's Guide
Statistical Analysis With R Beginner’s Guide

Why Use R for Statistical Analysis?

R is a powerful programming language and software environment for statistical computing and graphics. It offers a wide range of statistical and graphical techniques, making it a popular choice among statisticians, researchers, and data analysts. Here are some reasons why R is favored for statistical analysis:

  1. Open-Source: R is an open-source language, meaning it is freely available to everyone. This makes it accessible to beginners and allows for a vibrant community of users who contribute to its development.
  2. Extensive Libraries: R has a vast collection of libraries, or packages, that provide specialized functions and tools for various statistical analyses. These packages make complex analyses easier to perform and enable users to customize their workflows.
  3. Data Visualization: R offers excellent capabilities for data visualization, allowing users to create visually appealing and informative plots and charts. Visualizations aid in understanding data patterns and conveying insights effectively.
  4. Reproducibility: R promotes reproducibility by providing a script-based approach to analysis. You can save your code, which makes it easier to share and reproduce analyses, ensuring transparency and integrity.

Getting Started with R for Statistical Analysis

Now that we understand the importance of statistical analysis and why R is a valuable tool, let’s begin our journey by setting up R and getting familiar with its basic functionalities.

Installing R and RStudio

To get started with R, you need to install both R and an integrated development environment (IDE) called RStudio. RStudio provides a user-friendly interface for writing code, managing projects, and visualizing data.

  1. Download R: Visit the R Project website and download the latest version of R for your operating system. Follow the installation instructions provided.
  2. Download RStudio: Go to the RStudio download page and download the free version of RStudio Desktop. Install it using the provided instructions.

Basics of R Syntax

R uses a combination of functions, operators, and variables to perform calculations and manipulate data. Let’s familiarize ourselves with some basic concepts:

  1. Variables: In R, variables are used to store data values. You can assign a value to a variable using the assignment operator (<- or =). For example, x <- 5 assigns the value 5 to the variable x.
  2. Data Types: R supports various data types, including numeric, character, logical, and more. You can check the data type of a variable using the class() function. For example, class(x) would return "numeric" if x is a numeric variable.
  3. Functions: R provides a vast number of built-in functions for performing calculations and data manipulation. Functions take input values (arguments) and return output. For example, the mean() function calculates the average of a set of numbers.

Importing and Exploring Data

To perform statistical analysis, we often need to import data into R. R supports various file formats, such as CSV, Excel, and SQL databases. Let’s look at how to import a CSV file:

# Importing a CSV file
data <- read.csv("data.csv")

Once the data is imported, we can explore it using various functions and techniques. Here are a few essential functions:

  1. head(): Displays the first few rows of the dataset.
  2. summary(): Provides a summary of the dataset, including measures like mean, median, and quartiles.
  3. str(): Shows the structure of the dataset, including the variable names and their data types.

Descriptive Statistics

Descriptive statistics summarize and describe the main features of a dataset. They help us understand the distribution, central tendency, and variability of the data. Here are some commonly used descriptive statistics functions in R:

  1. mean(): Calculates the arithmetic mean of a set of numbers.
  2. median(): Determines the middle value of a dataset.
  3. sd(): Calculates the standard deviation, a measure of data dispersion.
  4. min() and max(): Find the minimum and maximum values in a dataset.

Statistical Tests and Analysis

R provides a wide range of statistical tests and analysis techniques for hypothesis testing, comparing groups, regression analysis, and more. Let’s explore a few examples:

  1. t-Test: The t-test is used to compare the means of two groups and determine if they are significantly different. The t.test() function in R performs t-tests.
  2. ANOVA: Analysis of Variance (ANOVA) is used to compare means across multiple groups. The anova() function in R performs ANOVA.
  3. Linear Regression: Linear regression is used to model the relationship between a dependent variable and one or more independent variables. The lm() function in R is used to perform linear regression.

FAQ’s

Q: Can I use R for statistical analysis if I have no programming experience?

Yes, you can! R is beginner-friendly, and many resources are available online to help you learn. Start with basic tutorials and gradually build your skills.

Q: Are there any alternatives to R for statistical analysis?

Yes, there are other programming languages like Python and SAS that are also widely used for statistical analysis. However, R’s extensive packages and its focus on statistical computing make it a popular choice in the field.

Q: Is R suitable for big data analysis?

R is primarily designed for small to medium-sized datasets. However, with the development of packages like dplyr and data.table, R can handle larger datasets efficiently.

Q: Can I create interactive visualizations using R?

Yes, R offers several packages, such as ggplot2 and plotly, which allows you to create interactive and visually appealing plots and charts.

Q: How can I find help and support while learning R?

There is a vast community of R users who are active on forums, blogs, and social media platforms. Websites like Stack Overflow and R-bloggers are excellent resources for finding help and learning from others.

Q: Can I use R for data cleaning and preprocessing?

Absolutely! R provides numerous functions and packages for data cleaning, manipulation, and preprocessing. Packages like dplyr and tidyverse are particularly useful for the tasks.

Conclusion

In this beginner’s guide to statistical analysis with R, we have explored the fundamentals of using R for data analysis. We learned about the importance of statistical analysis, why R is a popular choice, and how to get started with R and RStudio. We covered the basics of R syntax, importing and exploring data, descriptive statistics, and common statistical tests. Remember, practice is key to mastering statistical analysis with R, so don’t hesitate to apply your knowledge to real-world datasets and explore the vast range of packages and techniques available.

Statistical analysis with R opens up a world of possibilities for researchers, data analysts, and enthusiasts. By harnessing the power of R, you can uncover valuable insights, make data-driven decisions, and contribute to the field of statistics. So, start your journey today and unlock the potential of statistical analysis with R!

Download: Mathematical Foundations of Data Science Using R

Introduction to Statistical Learning with Applications in Python

Introduction to Statistical Learning with Applications in Python: Statistical learning, also known as machine learning, has become a powerful tool in the field of data analysis and decision-making. It involves the development of algorithms and statistical models to make predictions or take actions based on data. With the advent of Python and its extensive libraries, statistical learning has become more accessible and easier to implement.

In this article, we will provide a comprehensive introduction to statistical learning with a focus on its applications in Python. We will cover the fundamental concepts, techniques, and libraries used in statistical learning, and provide practical examples to demonstrate their application.

Introduction to Statistical Learning with Applications in Python

1. Introduction to Statistical Learning

Statistical learning is the process of extracting insights and making predictions from data. It involves studying patterns and relationships within the data to develop models that can generalize well to new, unseen data. Statistical learning encompasses both supervised and unsupervised learning techniques.

Supervised learning involves training a model using labeled data, where the input variables (features) are known, and the corresponding output variable (response) is provided. The goal is to learn a mapping between the input and output variables, which can then be used to make predictions on new, unseen data.

Unsupervised learning, on the other hand, deals with unlabeled data. The goal is to discover hidden patterns or structures within the data without any prior knowledge of the output variable. Unsupervised learning algorithms are often used for exploratory data analysis and clustering.

2. Supervised Learning

Regression

Regression is a type of supervised learning that focuses on predicting continuous numerical values. It involves fitting a mathematical function to the data, which can then be used to predict the response variable. Regression algorithms aim to minimize the difference between the predicted and actual values by adjusting the model’s parameters.

Classification

Classification is another type of supervised learning that deals with predicting categorical or discrete values. It involves assigning input data points to predefined classes or categories based on their features. Classification algorithms learn from labeled data to build a decision boundary that separates different classes in the feature space.

3. Unsupervised Learning

Clustering

Clustering is a technique used in unsupervised learning to group similar data points together. The goal is to identify inherent structures or clusters within the data without any prior knowledge of the class labels. Clustering algorithms assign data points to clusters based on their similarity, using various distance or similarity measures.

Dimensionality Reduction

Dimensionality reduction is another unsupervised learning technique that aims to reduce the number of input variables while preserving important information. It is particularly useful when dealing with high-dimensional data, as it can simplify the analysis and improve model performance. Dimensionality reduction methods transform the data into a lower-dimensional space while retaining as much of the original data’s variability as possible.

4. Evaluation and Validation

To assess the performance and generalization capabilities of statistical learning models, evaluation and validation techniques are employed. Cross-validation is a widely used technique to estimate a model’s performance on unseen data by splitting the available data into training and testing sets. It helps in assessing how well the model generalizes to new data and enables model selection and hyperparameter tuning.

Another important concept in statistical learning is the bias-variance tradeoff. It represents a fundamental challenge in model building, as models with low bias tend to have high variance, and vice versa. Achieving the right balance is crucial for optimal model performance.

5. Popular Python Libraries for Statistical Learning

Python provides a rich ecosystem of libraries that facilitate statistical learning tasks. Some of the most popular ones include:

NumPy

NumPy is a fundamental library for scientific computing in Python. It provides support for large, multi-dimensional arrays and matrices, along with a collection of mathematical functions to operate on them. NumPy’s efficient data structures and array operations make it a crucial component in many statistical learning workflows.

Pandas

Pandas is a versatile data manipulation library built on top of NumPy. It offers easy-to-use data structures and data analysis tools, making it highly suitable for data preprocessing tasks in statistical learning. Pandas enable efficient data loading, cleaning, transformation, and exploration.

Scikit-learn

Scikit-learn is a comprehensive machine-learning library that provides a wide range of supervised and unsupervised learning algorithms. It offers a consistent API and extensive documentation, making it an excellent choice for beginners and experts alike. Scikit-learn covers various tasks, including classification, regression, clustering, and dimensionality reduction.

6. Hands-on Example: Predicting House Prices

To illustrate the concepts discussed so far, let’s consider a hands-on example of predicting house prices. We will use a dataset containing information about different houses, such as their size, number of bedrooms, location, and price. By applying regression techniques and utilizing Python’s libraries, we can develop a model to predict house prices based on these features.

7. Conclusion

In conclusion, statistical learning is a powerful approach for extracting insights and making predictions from data. Python, with its extensive libraries such as NumPy, Pandas, and Scikit-learn, provides a versatile platform for implementing statistical learning algorithms. By understanding the fundamental concepts and techniques of statistical learning, you can leverage its potential to solve real-world problems and make data-driven decisions.

FAQs

  1. What is statistical learning? Statistical learning, also known as machine learning, is the process of developing algorithms and statistical models to make predictions or take actions based on data.
  2. What is the difference between supervised and unsupervised learning? Supervised learning deals with labeled data, where the input and output variables are known, while unsupervised learning deals with unlabeled data.
  3. What are some popular Python libraries for statistical learning? Popular Python libraries for statistical learning include NumPy, Pandas, and Scikit-learn.
  4. What is regression in statistical learning? Regression is a type of supervised learning that focuses on predicting continuous numerical values.
  5. What is clustering in unsupervised learning? Clustering is an unsupervised learning technique used to group similar data points based on their similarity.

Download(PDF)

Download: Python for Data Science For Dummies

Modern Statistics with R

In the world of data analysis and statistical modeling, the programming language R has emerged as a powerful tool. With its extensive library of statistical functions and packages, R has become a go-to choice for researchers, analysts, and statisticians alike. In this article, we will explore the use of R in modern statistics and delve into its key features and capabilities.

Understanding Modern Statistics

Modern statistics encompasses a wide range of techniques and methodologies used to analyze and interpret data. It involves the application of mathematical and statistical principles to draw meaningful conclusions and make informed decisions. Traditional statistical methods have been greatly enhanced by advancements in computing power and the availability of large datasets. This has led to the development of new statistical techniques and the need for tools that can handle complex data analysis tasks efficiently.

Modern Statistics with R

The Power of R in Data Analysis

R is a versatile programming language and environment specifically designed for statistical computing and graphics. It provides a comprehensive set of tools for data manipulation, exploration, modeling, and visualization. With its extensive collection of packages, R enables statisticians to implement a wide range of statistical techniques and algorithms.

Data Manipulation and Exploration

One of the critical strengths of R is its ability to handle data manipulation and exploration tasks efficiently. R provides a variety of functions and packages, such as dplyr and tidyr, that facilitate data cleaning, transformation, and summarization. These tools allow researchers to prepare their data for analysis by filtering, sorting, and aggregating it effectively.

Statistical Modeling with R

R offers various statistical modeling techniques, ranging from classical linear regression to advanced machine learning algorithms. Researchers can leverage packages like stats, caret, and glmnet to perform regression analysis, time series analysis, clustering, classification, and more. The flexibility of R enables statisticians to tailor their models to specific research questions and datasets.

Visualizing Data with R

Data visualization is a crucial aspect of statistical analysis. R provides a rich ecosystem of packages, including ggplot2 and plotly, that allows researchers to create stunning visual representations of their data. From basic scatter plots to complex interactive visualizations, R empowers users to explore patterns, relationships, and trends in their datasets.

Machine Learning with R

The field of machine learning has gained significant momentum in recent years. R offers several packages, such as caret, randomForest, and xgboost, that enable researchers to build and evaluate machine learning models. These packages provide implementations of various algorithms, including decision trees, random forests, support vector machines, and neural networks.

Reproducible Research with R

Reproducibility is a fundamental principle in scientific research. R promotes reproducible research by providing tools like R Markdown and knitr. These tools allow researchers to create dynamic documents that combine code, text, and visualizations, making it easy to share and reproduce their analyses.

Collaborative Analysis with R

Collaboration plays a vital role in data analysis projects. R facilitates collaboration by supporting version control systems like Git and providing integration with platforms like GitHub. Researchers can work together seamlessly, share code and data with their colleagues, and track changes in their analyses.

R in Industry and Academia

The popularity of R extends beyond the realm of academia and research. Many industries, including finance, healthcare, marketing, and technology, rely on R for data analysis and decision-making. Companies use R to extract insights from their data, make data-driven business decisions, and develop predictive models. In academia, R is widely used in various fields, including social sciences, economics, and biology, to analyze data and conduct statistical research.

The Future of R in Statistics

As data continues to grow in volume and complexity, the demand for robust statistical tools will only increase. With its vast ecosystem of packages and active community of developers, R is well-positioned to meet these evolving needs. The R language continues to evolve, incorporating new features and improving performance. With advancements in technologies like machine learning and artificial intelligence, R will likely play a crucial role in shaping the future of statistics.

Conclusion

In this article, we explored the significance of R in modern statistics. We discussed how R empowers researchers and statisticians with its extensive capabilities in data manipulation, statistical modeling, visualization, machine learning, reproducible research, and collaborative analysis. The versatility and flexibility of R make it an invaluable tool for analyzing and interpreting complex datasets. As the field of statistics continues to evolve, R will remain a prominent choice for data analysis and decision-making.

FAQs

1. Can I use R for big data analysis?

Yes, R offers several packages and frameworks, such as bigmemory and SparkR, that enable efficient processing and analysis of big datasets.

2. Is R suitable for beginners in statistics?

R has a steep learning curve for beginners, but there are numerous online resources, tutorials, and courses available to help beginners get started with R and statistics.

3. Are there alternatives to R for statistical analysis?

Yes, there are other programming languages like Python and SAS that are commonly used for statistical analysis. However, R’s extensive statistical functionality and its dedicated community make it a popular choice among statisticians.

4. Can I create interactive visualizations with R?

Yes, R offers packages like plotly and shiny that allows you to create interactive and dynamic visualizations for exploring and presenting data.

5. Is R only used for research purposes?

No, R is widely used in both research and industry. It is employed in various sectors, including finance, healthcare, marketing, and technology, for data analysis and decision-making.