Using R for Data Analysis and Graphics: In today’s data-driven world, the ability to analyze and visualize data effectively is crucial for making informed decisions. R, a powerful programming language and software environment, provides a wide range of tools and techniques for data analysis and graphics. In this article, we will explore the capabilities of R and how it can be utilized to gain valuable insights from data.
1. What is R?
R is a free and open-source programming language specifically designed for statistical computing and graphics. It provides a wide range of statistical and graphical techniques, making it a popular choice among data analysts and researchers. R has a vast collection of packages that extend its functionality, allowing users to perform complex data manipulations and advanced statistical modeling.
2. Installing R and RStudio
To get started with R, you need to install the R programming language and an integrated development environment (IDE) called RStudio. RStudio provides a user-friendly interface and additional tools that enhance the R programming experience. Both R and RStudio can be downloaded for free from their respective websites and are available for Windows, Mac, and Linux operating systems.
3. Loading and Manipulating Data
One of the first steps in data analysis is loading the data into R and preparing it for analysis. R offers various functions and packages for importing data from different file formats, such as CSV, Excel, or databases. Once the data is loaded, R provides powerful functions for manipulating and transforming the data, such as subsetting, merging, and reshaping, to suit the analysis needs.
4. Descriptive Statistics
Descriptive statistics summarize and describe the main features of a dataset. R provides a comprehensive set of functions to calculate common descriptive statistics, such as mean, median, standard deviation, and quartiles. These statistics help in understanding the central tendencies, dispersion, and distribution of the data. Additionally, R offers functions to compute correlations, perform hypothesis tests, and conduct exploratory data analysis.
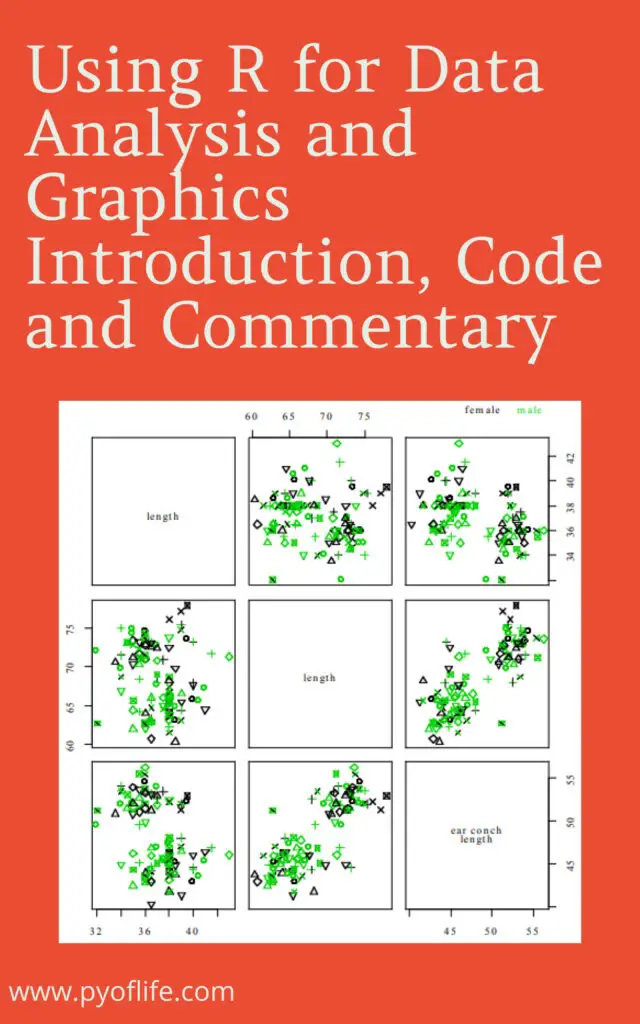
5. Data Visualization with Base R Graphics
R offers a wide range of graphical functions that allow users to create visually appealing and informative plots. Base R graphics provide a flexible system for creating various types of plots, including scatter plots, line plots, bar plots, histograms, and boxplots. These plots can be customized using different colors, symbols, and labeling options to effectively communicate the patterns and relationships within the data.
6. Creating Interactive Visualizations with ggplot2
ggplot2 is a popular data visualization package in R that provides a powerful and elegant grammar of graphics. It allows users to create complex and sophisticated visualizations with minimal code. ggplot2 follows a layered approach, where users can add different graphical elements, such as data points, lines, and facets, to build up a complete visualization. It also supports interactive features, making it easier to explore and analyze the data interactively.
7. Advanced Data Analysis Techniques
R offers advanced statistical modeling techniques for analyzing complex datasets. It includes packages for linear regression, logistic regression, time series analysis, clustering, and machine learning algorithms. These techniques allow analysts to uncover hidden patterns, predict outcomes, and make data-driven decisions. R’s extensive library of packages ensures that analysts have access to cutting-edge methodologies for various analytical tasks.
8. Reporting and Presenting Results
Once the data analysis is complete, R provides tools for generating high-quality reports and presentations. Packages like knitr and rmarkdown allow users to combine code, results, and narratives in a single document. This integration enables reproducible research and makes it easier to share findings with others. RMarkdown supports various output formats, such as HTML, PDF, and Word, allowing analysts to choose the most suitable format for their audience.
Conclusion
R is a versatile programming language that empowers data analysts and researchers to perform complex data analysis and create compelling visualizations. Its rich ecosystem of packages, combined with its statistical capabilities, makes it a valuable tool for anyone working with data. By leveraging R’s power, users can gain deeper insights, uncover trends, and effectively communicate their findings to others.
FAQs
- Can I use R for big data analysis?
- Yes, R has packages like
dplyranddata.tablethat can handle large datasets efficiently.
- Yes, R has packages like
- Is R suitable for machine learning?
- Absolutely! R has several packages, such as
caretandmlr, that provide a wide range of machine learning algorithms.
- Absolutely! R has several packages, such as
- Are there resources available to learn R?
- Yes, there are numerous online tutorials, books, and community forums dedicated to learning R. Some popular resources include RStudio’s website, R-bloggers, and the official R documentation.
- Can I create interactive dashboards with R?
- Yes, R offers packages like
shinythat that allow you to build interactive web applications and dashboards.
- Yes, R offers packages like
- Can I integrate R with other programming languages?
- R provides interfaces to many programming languages, including Python and C++, allowing you to leverage the strengths of multiple languages in your analysis.
