Essential Math for Data Science: Data science is a rapidly growing field that revolves around extracting insights and knowledge from data. While proficiency in programming languages and familiarity with various tools are crucial in this field, a solid foundation in mathematics forms the backbone of data science. Whether you’re analyzing datasets, building machine learning models, or interpreting results, a deep understanding of mathematical concepts is essential for success.
Introduction to Math in Data Science
Understanding why math is essential for data science is the first step in appreciating its significance. Mathematics provides the framework for formulating and solving problems in data science. Concepts such as statistics, linear algebra, and calculus enable data scientists to analyze data, make predictions, and optimize processes efficiently.
Probability theory and statistics play a crucial role in data science. Probability theory helps in quantifying uncertainty, while statistics provides methods for analyzing and interpreting data. Descriptive and inferential statistics aid in summarizing data and making inferences about populations based on sample data.
Linear algebra is the branch of mathematics that deals with vectors, matrices, and linear transformations. In data science, matrices are used to represent datasets, and operations such as matrix multiplication and finding eigenvalues are fundamental to various algorithms and models.
Calculus provides the mathematical tools for understanding change and optimization. Concepts like differentiation and integration are used in machine learning algorithms for gradient descent optimization, which is essential for training models and minimizing errors.
Mathematics finds applications in various aspects of data science, including machine learning, data visualization, and predictive analytics. Machine learning algorithms rely on mathematical principles for training models and making predictions, while data visualization techniques help in communicating insights effectively.
Conclusion
In conclusion, a solid understanding of mathematics is indispensable for anyone aspiring to excel in data science. From basic arithmetic to advanced calculus, mathematical concepts form the basis for solving complex problems and extracting meaningful insights from data.
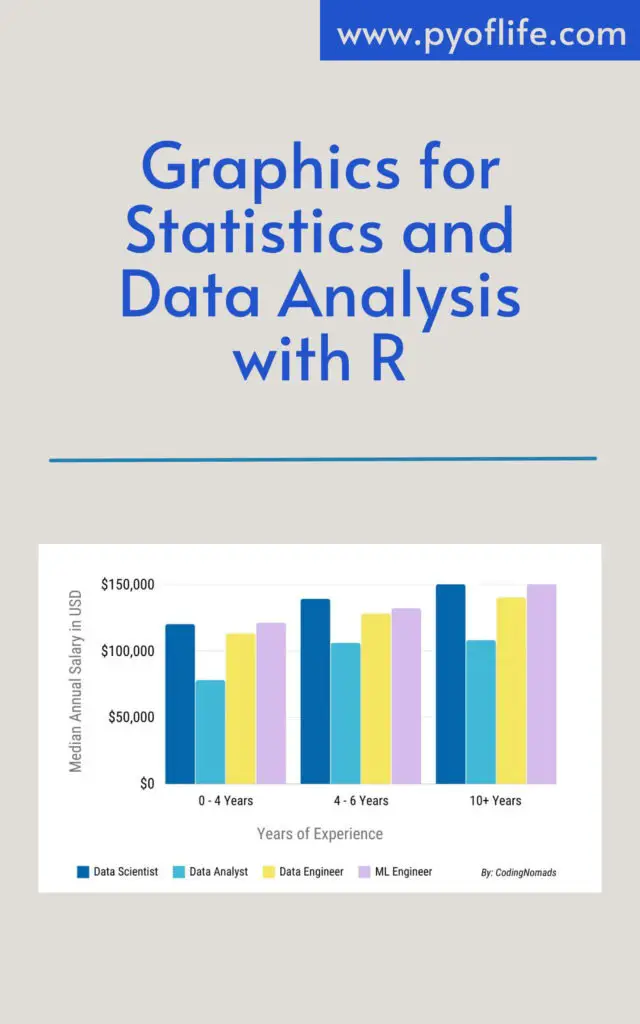
Graphics for Statistics and Data Analysis with R: In the realm of statistics and data analysis, visual representation plays a pivotal role in conveying insights effectively. Graphics, in this context, refer to the graphical representation of data through various plots, charts, and diagrams. These visuals are indispensable tools for analysts and researchers to comprehend complex datasets and communicate findings with clarity.
What are Graphics?
Graphics encompass a wide array of visual representations, including scatter plots, line graphs, bar charts, histograms, and more. These graphical elements serve to illustrate patterns, trends, and relationships within datasets, making it easier for data practitioners to interpret and draw conclusions.
Importance of Graphics in Data Analysis
The significance of graphics in data analysis cannot be overstated. While raw data may be difficult to interpret at a glance, well-designed graphics can elucidate underlying patterns and insights that might otherwise remain obscured. Moreover, visual representations facilitate effective communication of findings to stakeholders, enabling informed decision-making processes.
Data visualization is the graphical representation of information and data. It uses visual elements like charts, graphs, and maps to provide an accessible way to see and understand trends, outliers, and patterns in data.
Types of Data Visualization Techniques
Data visualization techniques vary based on the nature of the data and the insights being sought. Common types include:
Scatter plots: Displaying the relationship between two variables.
Line graphs: Showing trends over time or continuous data.
Histograms: Representing the distribution of numerical data.
Bar charts: Comparing categories of data using rectangular bars.
Introduction to R for Data Analysis
R is a powerful programming language and environment for statistical computing and graphics. It provides a wide variety of statistical and graphical techniques, making it a preferred choice for data analysis tasks.
Overview of R Programming Language
R is an open-source language with a vibrant community of users and developers. It offers extensive libraries and packages for various statistical analyses, making it versatile and adaptable to diverse data analysis needs.
Why Use R for Data Analysis?
R’s rich ecosystem of packages, particularly for graphics and visualization, sets it apart as a premier tool for data analysis. Its flexibility and scalability make it suitable for both exploratory data analysis and production-level applications.
Graphics Packages in R
R boasts several graphics packages, each with its strengths and capabilities. Some of the most prominent packages include ggplot2, lattice, and base R graphics.
ggplot2
ggplot2 is a widely used package for creating graphics in R. It follows a layered approach to plotting, allowing users to build complex visualizations with ease.
lattice
lattice is another popular package for producing trellis plots in R. It excels in creating conditioned plots, which display subsets of data based on specified conditions.
base R graphics
Base R graphics provide a foundation for creating basic plots such as scatter plots, histograms, and bar charts. While less flexible than ggplot2 or lattice, base R graphics are intuitive and sufficient for many data visualization tasks.
Creating Basic Plots in R
R offers straightforward methods for generating common types of plots, making them accessible to beginners and experts alike.
Scatter Plots
Scatter plots are useful for visualizing the relationship between two continuous variables. They plot data points on a two-dimensional plane, with one variable on each axis.
Line Graphs
Line graphs depict trends over time or continuous data points by connecting data points with straight lines. They are effective for illustrating changes and patterns in data.
Histograms
Histograms display the distribution of numerical data by dividing it into intervals, or bins, and counting the number of data points in each bin. They provide insights into the shape and spread of the data.
Bar Charts
Bar charts represent categorical data with rectangular bars of lengths proportional to the values they represent. They are suitable for comparing the frequencies or proportions of different categories.
Advanced Plotting Techniques
Once familiar with the basics, users can leverage advanced techniques to create more sophisticated and customized plots in R.
Adding Layers and Aesthetics in ggplot2
ggplot2 allows users to add layers to plots, enabling the overlay of multiple visual elements such as points, lines, and shapes. Additionally, aesthetics such as color, size, and shape can be customized to enhance the visual appeal of plots.
Customizing Plots with Themes and Color Palettes
Themes and color palettes can significantly impact the appearance of plots. ggplot2 offers a variety of pre-defined themes and color schemes, as well as options for creating custom themes to match specific preferences or branding requirements.
Faceting and Grouping Data
Faceting involves dividing a plot into multiple panels based on the values of one or more categorical variables. This allows for comparisons across different subsets of the data. Similarly, grouping data enables the creation of separate visualizations for each group, facilitating deeper insights into patterns and trends.
Interactive Visualization with Shiny
Shiny is an R package that enables the creation of interactive web applications for data visualization. It allows users to build dynamic dashboards and visualizations that respond to user inputs in real time.
Introduction to Shiny for Web-based Visualization
Shiny simplifies the process of developing interactive web-based applications, making it accessible to data analysts and researchers without extensive web development experience.
Building Interactive Dashboards with Shiny
Shiny provides a framework for designing interactive dashboards with features such as sliders, dropdown menus, and checkboxes for user interaction. These dashboards can incorporate multiple plots and visualizations, allowing users to explore data from different perspectives.
Best Practices in Data Visualization
Effective data visualization hinges on adhering to best practices that ensure clarity, accuracy, and interpretability.
Choosing the Right Plot for Your Data
Selecting the appropriate type of plot depends on the nature of the data and the insights being conveyed. Understanding the strengths and limitations of each plot type is essential for effective communication of findings.
Ensuring Clarity and Readability
Clear labeling, appropriate scaling, and judicious use of color are crucial for ensuring that visualizations are easily interpretable by viewers of varying backgrounds and expertise levels.
Labeling and Annotating Plots Effectively
Labels, titles, and annotations provide context and explanation for visualizations. They should be concise yet informative, guiding viewers’ interpretation of the data without overwhelming them with unnecessary detail.
Conclusion: Graphics for Statistics and Data Analysis with R
Graphics are indispensable tools for statistics and data analysis, enabling analysts to explore, visualize, and communicate insights effectively. R provides a comprehensive suite of tools and packages for creating a wide range of plots and visualizations, from basic charts to interactive dashboards. By mastering the fundamentals of data visualization and leveraging advanced techniques, analysts can unlock the full potential of graphics to extract meaningful insights from complex datasets.
Python, a versatile and widely used programming language, is renowned for its simplicity and readability. However, like any other programming language, it’s prone to errors. Understanding errors and mastering debugging techniques are essential skills for any Python programmer. This article delves into the different types of errors encountered in Python and explores effective debugging strategies to resolve them.
Types of Errors in Python
Understanding Syntax Errors
Syntax errors occur when the code violates the rules of the Python language. They’re typically detected during the compilation of code and prevent the program from running. Examples include missing parentheses, incorrect indentation, or misspelled keywords. Identifying and rectifying syntax errors is relatively straightforward, as Python provides informative error messages pinpointing the issue’s location.
Exploring Runtime Errors
Runtime errors, also known as exceptions, occur during the execution of a program. Common causes include division by zero, accessing an undefined variable, or attempting to perform unsupported operations. Unlike syntax errors, runtime errors are detected while the program is running. Python displays detailed error messages, including the type of exception and the line where it occurred, facilitating debugging.
Dealing with Logical Errors
Logical errors, often the most challenging to detect, occur when the code executes without raising any errors but produces incorrect results. These errors stem from flawed logic or algorithmic mistakes in the program. Debugging logical errors involves thorough code inspection, testing various inputs, and using debugging tools to trace the flow of execution and identify discrepancies.
Errors and Debugging in Python
Debugging Techniques
Printing Debugging
One of the simplest yet effective debugging techniques is inserting print statements throughout the code to output variable values, function calls, or program flow. By strategically placing print statements at crucial points in the code, programmers can track the program’s execution and identify the source of errors. While printing debugging provides visibility into the program’s behavior, it can be cumbersome and time-consuming for large codebases.
Using Python Debugger (pdb)
Python debugger, pdb, is a powerful built-in tool for interactive debugging. It allows programmers to inspect variables, set breakpoints, and step through code line by line. By invoking pdb within the code or running the script in debugging mode, developers gain granular control over the program’s execution, facilitating error detection and resolution. Pdb’s command-line interface provides various commands for navigating and manipulating the debugging session.
Debugging in Integrated Development Environments (IDEs)
Integrated Development Environments (IDEs) such as PyCharm, Visual Studio Code, and Jupyter Notebook offer advanced debugging tools to streamline the debugging process. These IDEs provide features like code stepping, variable inspection, and breakpoint management in a user-friendly interface. Developers can leverage IDEs’ debugging capabilities to efficiently troubleshoot complex issues and expedite the development cycle.
Best Practices for Error Handling
Try-Except Blocks
Try-except blocks are a fundamental error-handling mechanism in Python, allowing programmers to anticipate and handle exceptions gracefully. By enclosing potentially error-prone code within a try block and specifying exception handlers in except blocks, developers can prevent program crashes and gracefully handle unexpected errors. Nested try-except blocks enable hierarchical error handling, providing flexibility and robustness to the code.
Logging Errors
Python’s logging module offers a standardized approach to error logging and reporting. Developers can configure logging levels, formats, and output destinations to suit their application’s requirements. Integrating logging into Python applications facilitates error monitoring, troubleshooting, and performance analysis. By logging errors systematically, developers gain insights into the application’s behavior and ensure timely identification and resolution of issues.
Conclusion
Errors and debugging are integral parts of the programming journey, and Python is no exception. By understanding the types of errors encountered in Python and mastering effective debugging techniques, programmers can write robust and reliable code. Embracing error-handling best practices and leveraging debugging tools empower developers to tackle complex problems with confidence, ultimately enhancing the quality and efficiency of Python applications.
R is a powerful programming language and environment for statistical computing and graphics. It provides a wide variety of statistical and graphical techniques, making it a preferred choice for data analysis among statisticians and data scientists worldwide. This article serves as a comprehensive guide to practicing R for statistical computing, covering essential topics from setting up your environment to advanced statistical analysis and resources for further learning.
Setting up R Environment
Before diving into R programming, it’s essential to set up your environment. Firstly, you need to install R, which is freely available for Windows, Mac, and Linux operating systems. After installing R, it’s recommended to use RStudio, an integrated development environment (IDE) for R programming. RStudio provides a user-friendly interface with powerful features for writing, debugging, and executing R code efficiently.
Once your environment is set up, you can start exploring basic operations in R. R supports various data types, including numeric, character, logical, and factors. You can perform basic arithmetic operations like addition, subtraction, multiplication, and division using R. Assigning values to variables is straightforward in R, allowing you to store and manipulate data effectively.
Data Manipulation in R
One of the strengths of R is its ability to manipulate data efficiently. You can import data from various file formats such as CSV, Excel, and databases into R for analysis. Subsetting data allows you to extract specific rows or columns based on conditions. Data cleaning and transformation are essential steps in data analysis, and R provides powerful tools for handling missing values, and outliers, and transforming data into the desired format.
Statistical Analysis with R
R offers a wide range of statistical analysis techniques for exploring and summarizing data. Descriptive statistics such as mean, median, and standard deviation help in understanding the central tendency and dispersion of data. Inferential statistics allow you to make predictions and inferences about populations based on sample data. Data visualization plays a crucial role in data analysis, and R provides numerous packages for creating informative plots and charts.
Advanced Topics in R
Once you’re familiar with the basics, you can explore advanced topics in R to take your skills to the next level. Machine learning with R enables you to build predictive models and perform classification, regression, and clustering tasks. Time series analysis is useful for analyzing data collected over time, such as stock prices, weather patterns, and economic indicators. Spatial analysis involves analyzing geographic data to uncover patterns and relationships in spatial datasets.
R Packages and Resources
R boasts a vast ecosystem of packages contributed by the R community, covering a wide range of topics from data visualization to machine learning. Some popular R packages include ggplot2 for data visualization, dplyr for data manipulation, and caret for machine learning. Additionally, there are plenty of online resources available for learning R, including tutorials, documentation, and community forums where you can seek help and guidance from fellow R users.
Conclusion
Practicing R for statistical computing opens up a world of possibilities for data analysis and interpretation. By mastering essential concepts and techniques in R, you can gain valuable insights from data and make informed decisions in various domains, including business, academia, and research. Whether you’re a beginner or an experienced data analyst, R offers a flexible and powerful platform for turning raw data into actionable insights.
R Programming and Its Applications in Financial Mathematics: R Programming is a powerful open-source language and environment for statistical computing and graphics. It is widely used by statisticians, data analysts, researchers, and now, increasingly, in the domain of financial mathematics. Its flexibility, extensive libraries, and active community make it a preferred choice for data analysis and modeling.
Importance of R Programming in Financial Mathematics
Financial mathematics involves the application of mathematical methods to solve problems in finance. R Programming plays a crucial role in this field by providing tools for analyzing financial data, implementing mathematical models, and performing complex calculations efficiently.
R Programming and Its Applications in Financial Mathematics
Financial mathematics deals with various fundamental concepts such as the Time Value of Money and Interest Rates. These concepts form the building blocks for more advanced financial modeling and analysis.
Time Value of Money: R Programming helps in calculating the present and future values of cash flows, which is essential for making investment decisions.
Interest Rates: R facilitates the computation of interest rates and their effects on different financial instruments.
R Programming Libraries for Financial Mathematics
Several R packages are specifically designed for financial mathematics:
QuantLib: It provides a comprehensive library for quantitative finance, enabling users to implement advanced financial models and perform various calculations related to derivatives pricing, risk management, and more.
fOptions: This package is dedicated to option pricing and risk management, offering functions to value various types of options and analyze their sensitivities to different factors.
Applications of R Programming in Financial Mathematics
R Programming finds diverse applications in financial mathematics:
Risk Management: R is used to develop models for assessing and managing financial risks, such as market risk, credit risk, and operational risk.
Portfolio Optimization: It helps in constructing optimal investment portfolios by considering factors like risk tolerance, expected returns, and correlation among assets.
Option Pricing: R enables the pricing and valuation of options, allowing traders and investors to make informed decisions regarding derivatives trading.
Case Studies
Real-world examples demonstrate the practical utility of R Programming in financial mathematics:
Risk Analysis Using R: A case study illustrating how R can be employed to analyze and mitigate risks in investment portfolios.
Portfolio Diversification with R: An example showcasing the use of R for optimizing portfolio diversification strategies to enhance returns and minimize risks.
Challenges and Limitations
Despite its strengths, R Programming faces certain challenges in the context of financial mathematics, such as scalability issues with large datasets and the need for proficient programming skills.
Future Trends and Innovations
The future of R Programming in financial mathematics looks promising, with ongoing developments in areas like machine learning, deep learning, and blockchain technology poised to further expand its applications and capabilities.
Conclusion
In conclusion, R Programming serves as a valuable tool for conducting quantitative analysis and modeling in financial mathematics. Its versatility and extensive libraries empower finance professionals to tackle complex problems and make informed decisions in various domains of finance.
Modern R Programming Cookbook: R programming language has become a powerhouse in modern data science and statistical computing. Its versatility and extensive library ecosystem make it a favorite among data analysts, statisticians, and researchers worldwide. This article will explore the essential tools, techniques, and best practices for modern R programming.
Setting Up Your R Environment
Before diving into R programming, it’s crucial to set up your development environment. Start by installing R and RStudio, which provide an integrated development environment (IDE) for R. Additionally, you’ll want to install essential packages like tidyverse, which includes dplyr and ggplot2, among others, to streamline your workflow.
Data Manipulation with dplyr
The dplyr package is a cornerstone of modern R programming, offering a concise and intuitive syntax for data manipulation tasks. With dplyr, you can easily filter, arrange, mutate, summarize, and join data frames, empowering you to perform complex data manipulations with ease.
Visualizing data is essential for gaining insights and communicating findings effectively. The ggplot2 package provides a powerful grammar of graphics for creating elegant and customizable plots in R. Whether you’re plotting simple histograms or intricate multi-layered visualizations, ggplot2 has you covered.
Working with DataFrames
DataFrames are fundamental data structures in R, representing tabular data with rows and columns. Understanding how to manipulate and analyze DataFrames is crucial for any R programmer. From basic operations like subsetting and merging to more advanced tasks like reshaping and aggregating, mastering DataFrames is key to becoming proficient in R.
Advanced-Data Analysis Techniques
In addition to basic data manipulation and visualization, R offers a wide range of advanced data analysis techniques. From statistical modeling and hypothesis testing to machine learning and text analysis, R provides tools for tackling complex analytical challenges.
Web Scraping with rvest
The internet is a treasure trove of data, and the rvest package allows you to scrape and extract data from web pages with ease. Whether you’re collecting data for research purposes or gathering information for analysis, rvest provides the tools you need to scrape web content efficiently.
Text Analysis with tidytext
Text data is ubiquitous in the digital age, and the tidytext package offers a tidy approach to text mining and analysis in R. With tidytext, you can perform sentiment analysis, topic modeling, and more, unlocking valuable insights from unstructured text data.
Machine Learning with caret
The caret package serves as a unified interface to various machine learning algorithms in R, making it easy to train and evaluate models for predictive analytics. Whether you’re building classification models, regression models, or clustering algorithms, caret simplifies the machine-learning workflow in R.
Shiny App Development
Shiny is an R package that enables you to build interactive web applications directly from R scripts. With Shiny, you can create dynamic dashboards, data visualization tools, and more, without needing to learn web development languages like HTML, CSS, or JavaScript.
Collaboration and Version Control with Git and GitHub
Effective collaboration and version control are essential for any software development project, and R programming is no exception. By leveraging Git and GitHub, you can track changes to your code, collaborate with other developers, and ensure reproducibility and transparency in your projects.
Optimization and Performance Tuning
As your R projects grow in complexity, optimizing the performance of your code becomes increasingly important. Techniques like vectorization, parallelization, and memory management can help improve the efficiency of your R code, ensuring that it runs smoothly even with large datasets.
Debugging and Error Handling
Debugging is an inevitable part of programming, and R provides tools for identifying and fixing errors in your code. By mastering debugging techniques and implementing robust error-handling strategies, you can write more reliable and maintainable R code.
Package Development
Creating and publishing R packages is a great way to share your code with the R community and contribute to the ecosystem. Whether you’re developing utilities for data manipulation, algorithms for statistical analysis, or applications for specific domains, packaging your code makes it easier for others to use and build upon.
Conclusion
In this article, we’ve explored the essential tools, techniques, and best practices for modern R programming. From data manipulation and visualization to machine learning and package development, R offers a comprehensive suite of tools for tackling a wide range of analytical challenges. By mastering these techniques and incorporating them into your workflow, you can unlock the full potential of R for data science and beyond.
Deep R Programming: Unlocking the Power of Data with R: In the realm of data science, the fusion of Deep Learning with R programming has emerged as a game-changer, enabling analysts and researchers to unlock hidden insights within vast datasets. Deep R Programming, a powerful combination of the versatile R language and cutting-edge deep learning techniques, offers a comprehensive toolkit for tackling complex data challenges.
Introduction to Deep R Programming
Deep R Programming stands at the intersection of two dynamic fields: R programming and Deep Learning. R, a statistical computing language renowned for its flexibility and ease of use, provides a rich ecosystem for data manipulation, visualization, and analysis. On the other hand, Deep Learning, a subset of machine learning, focuses on training artificial neural networks to mimic the human brain’s ability to learn and adapt.
Understanding R Programming Language
R programming language serves as the foundation for Deep R Programming. With its vast collection of packages and libraries, R offers various functionalities for statistical computing, machine learning, and data visualization. Its syntax, resembling natural language, makes it accessible to both novice and experienced programmers.
Deep R Programming: Unlocking the Power of Data with R
Deep Learning involves training neural networks with large amounts of data to recognize patterns and make predictions. This technology has revolutionized various industries, including healthcare, finance, and autonomous vehicles, by enabling tasks such as image classification, speech recognition, and natural language processing.
Integration of Deep Learning with R Programming
Deep R Programming bridges the gap between traditional statistical analysis and modern deep learning techniques. By leveraging R’s data handling capabilities and integrating them with powerful deep learning libraries such as TensorFlow and Keras, analysts can build sophisticated models for complex data problems.
Benefits of Deep R Programming
Deep R Programming offers several advantages for data scientists and analysts. Its seamless integration with existing R workflows allows for efficient data preprocessing, model training, and evaluation. Moreover, the interpretability of R code facilitates model debugging and performance optimization.
Applications of Deep R Programming
The versatility of Deep R Programming is evident in its wide range of applications. From exploratory data analysis and predictive modeling to advanced tasks such as image recognition and natural language processing, Deep R enables researchers to extract valuable insights from diverse datasets.
Getting Started with Deep R Programming
To embark on the journey of Deep R Programming, one must first set up the necessary environment by installing R and relevant packages. Familiarizing oneself with basic R syntax and commands lays the groundwork for exploring deep learning concepts and techniques.
Advanced Techniques in Deep R Programming
As proficiency in Deep R Programming grows, analysts can delve into advanced topics such as neural network architectures, hyperparameter tuning, and model optimization. These techniques enable the creation of robust and accurate models for complex data problems.
Best Practices for Deep R Programming
Adhering to best practices ensures the efficiency and reliability of Deep R Programming projects. Structuring code modular and organized, documenting procedures, and implementing robust error handling mechanisms are essential for maintaining code quality and reproducibility.
Challenges and Limitations
Despite its numerous benefits, Deep R Programming is not without challenges. Issues such as overfitting, computational complexity, and data scarcity pose significant hurdles that require careful consideration and mitigation strategies.
Future Trends in Deep R Programming
The future of Deep R Programming holds promise for further innovation and advancement. As the field continues to evolve, we expect to see improvements in tooling, techniques, and integration with emerging technologies such as cloud computing and edge computing.
Case Studies
Real-world case studies demonstrate the practical applications and effectiveness of Deep R Programming across various domains. From predicting customer churn in e-commerce to diagnosing diseases in healthcare, these examples highlight the transformative impact of Deep R on data-driven decision-making.
Conclusion
In conclusion, Deep R Programming represents a convergence of traditional statistical analysis and modern deep learning techniques, offering a powerful toolkit for data scientists and analysts. By harnessing the combined strengths of R programming and deep learning, practitioners can unlock the full potential of their data and drive innovation in diverse fields.
Python has become one of the most popular programming languages in recent years, known for its simplicity and versatility. If you are a beginner who wants to dive into the world of coding, “Python Crash Course” is an excellent starting point. This article aims to explore the details of this hands-on, project-based introduction to programming.
Introduction to Python Crash Course
“Python Crash Course” is a book written by Eric Matthes, designed to teach programming fundamentals through practical projects and examples. It caters to individuals with little to no prior experience in coding, making it an ideal choice for beginners.
Python’s popularity stems from its readability and ease of learning. Its straightforward syntax allows beginners to grasp fundamental programming concepts quickly. Additionally, Python’s extensive libraries and frameworks make it suitable for various applications, including web development, data analysis, artificial intelligence, and more.
The Structure of Python Crash Course
The book is divided into three main parts:
Part 1: Basics
In this section, readers are introduced to Python’s syntax, variables, data types, and control flow structures. Concepts such as loops, conditional statements, and functions are covered in-depth, laying a solid foundation for further learning.
Part 2: Projects
The heart of “Python Crash Course” lies in its project-based approach. Readers engage in hands-on activities, including building a simple game, creating data visualizations, and developing web applications. These projects not only reinforce theoretical knowledge but also provide practical experience.
Part 3: Advanced Topics
The final section delves into more advanced Python concepts, including object-oriented programming, file handling, modules, debugging, and error handling. Readers learn how to write cleaner, more efficient code and tackle complex problems effectively.
Benefits of a Hands-On, Project-Based Approach
The project-based nature of “Python Crash Course” offers several advantages:
Engagement: By working on real-world projects, readers stay engaged and motivated throughout the learning process.
Practical Experience: Projects provide hands-on experience, allowing readers to apply theoretical concepts to practical situations.
Problem-Solving Skills: Tackling projects helps develop critical thinking and problem-solving skills essential for any programmer.
Portfolio Building: Completed projects can be added to one’s portfolio, showcasing skills to potential employers or collaborators.
Who Can Benefit from Python Crash Course?
“Python Crash Course” is suitable for:
Absolute Beginners: Individuals with no prior programming experience.
Students: Those studying computer science or related fields.
Professionals: Looking to expand their skill set or transition into a career in programming.
Hobbyists: Interested in learning programming as a hobby or for personal projects.
Conclusion
This book provides a comprehensive introduction to programming through practical, hands-on projects. Its structured approach, combined with clear explanations and engaging projects, makes it an excellent choice for beginners looking to learn Python programming.
Introduction to R Programming Language: R is a powerful programming language and environment primarily used for statistical computing and graphics. It provides a wide variety of statistical and graphical techniques, making it a preferred choice for data analysis and visualization tasks. In this article, we will delve into the basics of R programming, its history, features, syntax, data structures, control structures, functions, packages, data manipulation, data visualization, statistical analysis, advanced topics, and applications.
History of R
R was developed by Ross Ihaka and Robert Gentleman at the University of Auckland, New Zealand, in the early 1990s. It was inspired by the S programming language and environment, which was developed at Bell Laboratories by John Chambers et al. R quickly gained popularity among statisticians and researchers due to its open-source nature and extensive community support.
R provides efficient data handling capabilities, allowing users to import, export, manipulate, and analyze data from various sources such as files, databases, and web APIs.
Statistical and Graphical Techniques
One of the key features of R is its vast collection of built-in statistical and graphical techniques. Users can perform a wide range of statistical analyses and create high-quality graphics for data visualization purposes.
Installation and Setup
To start using R, you need to download and install it on your computer. R can be downloaded for free from the Comprehensive R Archive Network (CRAN) website. Additionally, RStudio, an integrated development environment (IDE) for R, can be installed to provide a more user-friendly interface for programming in R.
Basic Syntax
R has a simple and intuitive syntax that makes it easy for beginners to learn. It supports various data types such as numeric, character, logical, and complex, and provides operators for performing arithmetic, relational, and logical operations.
Data Structures
R supports a variety of data structures, including vectors, matrices, lists, and data frames. These data structures allow users to store and manipulate data efficiently.
Control Structures
R provides control structures such as conditional statements (if-else) and loops (for, while) for controlling the flow of execution in a program.
Functions
Functions are a fundamental concept in R programming. Users can create their own functions to perform specific tasks and reuse them as needed.
Packages
R packages are collections of R functions, data, and documentation that extend the functionality of R. There are thousands of packages available for various purposes, ranging from data visualization to machine learning.
Data Manipulation
R provides powerful tools for data manipulation, including functions for reading and writing data, cleaning and transforming data, and reshaping data into different formats.
Data Visualization
Data visualization is an essential aspect of data analysis, and R excels in this area. The ggplot2 package, for example, provides a flexible and powerful system for creating a wide variety of visualizations.
Statistical Analysis
R is widely used for statistical analysis, including descriptive statistics (e.g., mean, median, standard deviation) and inferential statistics (e.g., hypothesis testing, regression analysis).
Advanced Topics
In addition to basic data analysis, R can be used for more advanced tasks such as machine learning and web scraping.
Applications of R
R has numerous applications in both academic research and industry. It is used by statisticians, data analysts, researchers, and professionals across various fields for data analysis, visualization, and modeling.
Conclusion
In conclusion, R is a versatile programming language and environment that offers a wide range of capabilities for data analysis, visualization, and statistical computing. Whether you are a beginner or an experienced data scientist, R provides powerful tools and resources for tackling a variety of data-related tasks.
Learning Scientific Programming with Python: Scientific programming involves using computer programming languages to solve scientific problems. Python has emerged as one of the most popular languages for scientific programming due to its simplicity, versatility, and a vast ecosystem of libraries.
Getting Started with Python
Before diving into scientific programming, it’s essential to have a basic understanding of Python. You can start by installing Python on your system and getting familiar with its syntax, data types, and control structures.
Basics of Scientific Computing with Python
Two fundamental libraries for scientific computing in Python are NumPy and SciPy. NumPy supports numerical computations, while SciPy offers a wide range of scientific computing tools, including optimization, integration, interpolation, and linear algebra.
Data Visualization with Matplotlib
Data visualization is crucial for understanding and analyzing scientific data. Matplotlib is a powerful library for creating static, animated, and interactive visualizations in Python. It enables you to plot various types of graphs, charts, and diagrams to represent your data effectively.
Working with Data in Python
Pandas is a popular library for data manipulation and analysis in Python. It provides data structures and functions for efficiently handling structured data, such as tables and time series. With Pandas, you can easily clean, transform, and analyze large datasets.
In addition to NumPy, SciPy, and Matplotlib, Python offers several other libraries for specific scientific tasks. SymPy is a library for symbolic mathematics, allowing you to perform algebraic manipulations, calculus, and symbolic solving. Scikit-learn is a versatile library for machine learning, providing tools for classification, regression, clustering, dimensionality reduction, and more.
Application of Scientific Programming in Various Fields
Scientific programming with Python finds applications across various domains, including physics, biology, chemistry, and engineering. Researchers and scientists use Python to model physical systems, analyze biological data, simulate chemical reactions, and solve engineering problems.
Best Practices and Tips for Scientific Programming
When engaging in scientific programming, it’s essential to follow best practices to write efficient, maintainable, and reproducible code. This includes writing clear and concise code, using meaningful variable names, documenting your code, testing thoroughly, and leveraging version control systems like Git to manage your projects.
Conclusion
Learning scientific programming with Python opens up opportunities for researchers, scientists, engineers, and students. By mastering Python and its scientific libraries, you can tackle complex problems, gain insights from data, and contribute to advancements in various fields.