Learning Scientific Programming with Python: Scientific programming involves using computer programming languages to solve scientific problems. Python has emerged as one of the most popular languages for scientific programming due to its simplicity, versatility, and a vast ecosystem of libraries.
Getting Started with Python
Before diving into scientific programming, it’s essential to have a basic understanding of Python. You can start by installing Python on your system and getting familiar with its syntax, data types, and control structures.
Basics of Scientific Computing with Python
Two fundamental libraries for scientific computing in Python are NumPy and SciPy. NumPy supports numerical computations, while SciPy offers a wide range of scientific computing tools, including optimization, integration, interpolation, and linear algebra.
Data Visualization with Matplotlib
Data visualization is crucial for understanding and analyzing scientific data. Matplotlib is a powerful library for creating static, animated, and interactive visualizations in Python. It enables you to plot various types of graphs, charts, and diagrams to represent your data effectively.
Working with Data in Python
Pandas is a popular library for data manipulation and analysis in Python. It provides data structures and functions for efficiently handling structured data, such as tables and time series. With Pandas, you can easily clean, transform, and analyze large datasets.
In addition to NumPy, SciPy, and Matplotlib, Python offers several other libraries for specific scientific tasks. SymPy is a library for symbolic mathematics, allowing you to perform algebraic manipulations, calculus, and symbolic solving. Scikit-learn is a versatile library for machine learning, providing tools for classification, regression, clustering, dimensionality reduction, and more.
Application of Scientific Programming in Various Fields
Scientific programming with Python finds applications across various domains, including physics, biology, chemistry, and engineering. Researchers and scientists use Python to model physical systems, analyze biological data, simulate chemical reactions, and solve engineering problems.
Best Practices and Tips for Scientific Programming
When engaging in scientific programming, it’s essential to follow best practices to write efficient, maintainable, and reproducible code. This includes writing clear and concise code, using meaningful variable names, documenting your code, testing thoroughly, and leveraging version control systems like Git to manage your projects.
Conclusion
Learning scientific programming with Python opens up opportunities for researchers, scientists, engineers, and students. By mastering Python and its scientific libraries, you can tackle complex problems, gain insights from data, and contribute to advancements in various fields.
In today’s data-driven world, the ability to effectively visualize data is paramount. Data visualization not only helps in understanding complex datasets but also aids in conveying insights to others clearly and concisely. One powerful tool for data visualization is R, a programming language and environment specifically designed for statistical computing and graphics.
Understanding Data Visualization
Data visualization is the graphical representation of information and data. It enables analysts, researchers, and decision-makers to comprehend trends, patterns, and relationships within datasets. R provides a comprehensive set of tools and libraries for creating a wide range of visualizations, from simple scatter plots to complex interactive dashboards.
Getting Started with R Graphics Cookbook
Before diving into data visualization with R, you’ll need to install the necessary software and libraries. The R Graphics Cookbook serves as a handy guide for both beginners and experienced users alike, offering practical recipes for creating various types of plots and charts.
R Graphics Cookbook covers a plethora of visualization techniques, including scatter plots, line graphs, bar charts, histograms, and box plots. Each technique is accompanied by step-by-step instructions and example code, making it easy for readers to replicate the visualizations in their own projects.
Customizing Visualizations in R
One of the key strengths of R is its flexibility in customizing visualizations. From adjusting colors and themes to adding labels and annotations, R Graphics Cookbook provides numerous tips and tricks for enhancing the aesthetics and readability of your plots.
Advanced-Data Visualization Techniques
In addition to basic plots, R Graphics Cookbook also delves into advanced visualization techniques such as 3D plots, interactive graphics, and geospatial visualization. These advanced features allow users to create dynamic and engaging visualizations for exploring multidimensional datasets.
Tips and Tricks for Effective Visualization
Creating effective visualizations requires more than just knowing how to plot data. R Graphics Cookbook offers valuable insights into choosing the right chart types, handling large datasets efficiently, and applying design principles to make your visualizations more impactful and informative.
Case Studies and Practical Examples
Real-world case studies and examples are provided to demonstrate the practical applications of the R Graphics Cookbook. Readers can follow along with hands-on exercises, gaining valuable experience in applying data visualization techniques to solve real-world problems.
Conclusion
In conclusion, It is an indispensable resource for anyone looking to master the art of data visualization with R. Whether you’re a novice or an experienced data analyst, this cookbook offers a wealth of practical recipes and insights to help you create compelling visualizations that drive actionable insights.
Using R and RStudio for Data Management: When it comes to data science and statistical analysis, R and RStudio are considered to be powerful and versatile tools. By combining the capabilities of the R programming language with the user-friendly interface of RStudio, it offers a comprehensive solution for managing data, performing statistical analysis, and generating graphics.
Understanding Data Management with Rand RStudio
Importing and Exporting Data
One of the fundamental tasks in data analysis is importing data from various sources. With Rand RStudio, users can seamlessly import data from CSV files, Excel spreadsheets, databases, and other formats. Likewise, exporting processed data is equally effortless, enabling seamless collaboration and sharing of insights.
Data Cleaning and Transformation
Before delving into analysis, ensuring data cleanliness and coherence is paramount. Rand RStudio provides a myriad of functions and packages for data cleaning and transformation. From handling missing values to standardizing data formats, it empowers analysts to preprocess data efficiently, laying a solid foundation for subsequent analysis.
Using R and RStudio for Data Management, Statistical Analysis, and Graphics
R and RStudio offer an extensive array of functions for descriptive statistics, allowing analysts to summarize and explore datasets comprehensively. From calculating measures of central tendency to visualizing distributions, descriptive statistics in Rand RStudio facilitate a deep understanding of data characteristics.
Inferential Statistics
Beyond descriptive statistics, R and RStudio empower analysts to easily perform inferential statistics. Whether hypothesis testing, regression analysis, or ANOVA, R and RStudio provide robust tools and packages for conducting rigorous statistical inference, enabling users to derive meaningful insights and make informed decisions.
Creating Graphics with R and RStudio
Basic Plots
Visualizing data is essential for gaining insights and communicating findings effectively. R and RStudio offers a rich suite of plotting functions for creating basic plots such as histograms, scatter plots, and bar charts. With customizable features and intuitive syntax, generating informative visualizations becomes a seamless endeavor.
Advanced Visualizations
For more sophisticated graphics, R and RStudio doesn’t disappoint. Whether it’s creating interactive plots, heatmaps, or 3D visualizations, R and RStudio offer advanced packages and tools to cater to diverse visualization needs. From exploratory data analysis to presentation-ready graphics, R and RStudio equips analysts with the means to convey complex insights effortlessly.
Integrating Rand RStudio with Other Tools
R and RStudio’s compatibility with other tools further enhances its utility. Whether it’s integrating with Python libraries for machine learning or connecting to cloud-based platforms for big data analysis, R and RStudio facilitate seamless interoperability, enabling users to leverage a diverse ecosystem of resources for their analytical endeavors.
Best Practices for Efficient Data Management and Analysis
To maximize the effectiveness of Rand RStudio, adhering to best practices is crucial. This includes maintaining organized project structures, documenting code and analyses, leveraging version control systems, and staying updated with the latest packages and techniques. By embracing these practices, analysts can streamline their workflow, enhance reproducibility, and foster collaboration within their teams.
Conclusion
In conclusion, R and RStudio stand as a formidable ally for data management, statistical analysis, and graphics generation. Its versatility, ease of use, and robust functionality make it a preferred choice among data scientists, analysts, and researchers worldwide. By harnessing the power of R and RStudio, analysts can unlock valuable insights from data, drive evidence-based decision-making, and propel innovation across various domains.
Intro to Exploratory Data Analysis (EDA) in Python: In the world of data science, one of the initial and crucial steps in understanding a dataset is Exploratory Data Analysis (EDA). It’s like embarking on a journey where you explore the characteristics and patterns within your data before diving into any complex modeling. In this article, we’ll delve into what EDA is all about and how Python facilitates this process seamlessly with its powerful libraries.
Importance of EDA in Data Science
EDA serves as the foundation for any data analysis project. By visualizing and summarizing the main characteristics of a dataset, it helps analysts to:
Identify patterns and relationships
Detect outliers and anomalies
Understand the distribution and structure of the data
Formulate hypotheses for further analysis
Tools and Libraries for EDA in Python
Python offers a rich ecosystem of libraries for performing EDA efficiently. Some of the commonly used ones include:
Pandas
Pandas is a versatile library that provides data structures and functions to manipulate and analyze structured data. It offers powerful tools for reading, writing, and transforming data, making it a cornerstone for EDA.
Matplotlib
Matplotlib is a comprehensive library for creating static, animated, and interactive visualizations in Python. It enables users to generate various plots, from simple bar charts to complex 3D visualizations, ideal for exploring data distribution and relationships.
Seaborn
Seaborn is built on top of Matplotlib and provides a high-level interface for drawing attractive and informative statistical graphics. It simplifies the process of creating complex visualizations like heatmaps, pair plots, and categorical plots, enhancing theEDA experience.
Understanding Data Types
Before diving into analysis, it’s essential to understand the types of data present in the dataset:
Numeric Data
Numeric data consists of numbers and can be categorized as continuous or discrete. Understanding the distribution of numeric variables is crucial for identifying trends and outliers.
Categorical Data
Categorical data represents characteristics or qualities and often takes on a fixed number of possible values. Analyzing categorical variables involves examining frequency counts and distributions.
DateTime Data
DateTime data includes dates and times, which require special handling for meaningful analysis. Extracting features like the day of the week or month can reveal temporal patterns in the data.
Handling Missing Values
Dealing with missing values is a common challenge in real-world datasets. EDA involves assessing the extent of missingness and choosing appropriate strategies such as imputation or deletion to handle them effectively.
Descriptive Statistics
Descriptive statistics provide a summary of the main characteristics of a dataset. Measures like mean, median, standard deviation and percentiles offer insights into the central tendency and variability of the data.
Data Visualization Techniques
Visualization is a powerful tool for gaining insights into the data. Some commonly used techniques in EDA include:
Histograms
Histograms display the distribution of a numeric variable by dividing it into bins and plotting the frequency of observations within each bin.
Boxplots
Boxplots summarize the distribution of a numeric variable by displaying key statistics such as the median, quartiles, and outliers.
Scatter plots
Scatter plots reveal relationships between two numeric variables by plotting each data point as a dot on the graph.
Univariate Analysis
Univariate analysis focuses on examining the distribution and summary statistics of a single variable, providing insights into its characteristics.
Bivariate Analysis
Bivariate analysis explores the relationship between two variables, uncovering patterns and correlations that may exist between them.
Multivariate Analysis
Multivariate analysis extends bivariate analysis to multiple variables, allowing for a more comprehensive understanding of complex relationships within the data.
Outlier Detection and Treatment
Outliers can significantly impact the results of data analysis. EDA includes techniques for identifying and handling outliers to ensure robust and reliable insights.
Correlation Analysis
Correlation analysis measures the strength and direction of the relationship between two numeric variables, helping to identify potential dependencies and patterns.
Conclusion
Exploratory Data Analysis is a crucial step in the data analysis process, enabling analysts to uncover insights, detect patterns, and formulate hypotheses. By leveraging Python and its powerful libraries, analysts can streamline the EDA process and gain valuable insights into their datasets.
Linear Regression Using R: Linear Regression is one of the fundamental techniques in statistical modeling and machine learning. It’s widely used for understanding the relationship between two continuous variables. In simple terms, it helps in predicting one variable based on the value of another variable. In the realm of data science, Linear Regression plays a crucial role in analyzing and interpreting data patterns.
Understanding the Basics of Linear Regression
Assumptions of Linear Regression
Before delving into the practical aspects of Linear Regression, it’s essential to understand its underlying assumptions. These include linearity, independence of errors, homoscedasticity, and normality of residuals. Violation of these assumptions can affect the accuracy of the model.
Types of Linear Regression
Linear Regression comes in various forms, including simple linear regression with one predictor variable and multiple linear regression with multiple predictor variables. Additionally, there are extensions like polynomial regression and logistic regression, each serving specific purposes in data modeling.
Linear Regression Using R: An Introduction to Data Modeling
Data preparation is a crucial step before fitting a Linear Regression model. It involves tasks like cleaning outliers, handling missing values, and transforming variables to meet the assumptions of the model. In R, this process is facilitated by libraries like dplyr and tidyr.
Data Cleaning
Cleaning the data involves removing inconsistencies, dealing with missing values, and ensuring data quality. Techniques like imputation and deletion are commonly used to handle missing data points.
Data Exploration and Visualization
Exploring the dataset helps in understanding the relationship between variables and identifying patterns. Visualization techniques like scatter plots, histograms, and correlation matrices are used to gain insights into the data.
Implementing Linear Regression in R
Installing R and RStudio
To begin with, one needs to install R and RStudio, which are popular open-source tools for statistical computing and data analysis. They provide a user-friendly interface and a wide range of packages for implementing various algorithms.
Loading Data into R
Once R and RStudio are set up, the next step is to load the dataset into R. This can be done using functions like read.csv() or read.table() depending on the format of the data.
Building the Linear Regression Model
In R, building a linear regression model is straightforward with the lm() function. It takes the formula specifying the relationship between the predictor and response variables as input and fits the model to the data.
Evaluating the Model
After fitting the model, it’s crucial to assess its performance and interpret the results.
Assessing Model Performance
Common metrics for evaluating the performance of a linear regression model include R-squared, Mean Squared Error (MSE), and Root Mean Squared Error (RMSE). These metrics help in understanding how well the model fits the data.
Interpreting Model Results
Interpreting the coefficients of the regression equation provides insights into the relationship between predictor and response variables. It helps in understanding the direction and strength of the relationship.
Improving Linear Regression Models
Feature Selection
Feature selection involves choosing the most relevant variables for the model while discarding irrelevant ones. Techniques like forward selection, backward elimination, and ridge regression aid in selecting the optimal set of features.
Regularization Techniques
Regularization techniques like Ridge Regression and Lasso Regression help in preventing overfitting by penalizing large coefficients. They add a regularization term to the loss function, thereby controlling the complexity of the model.
Applications of Linear Regression in Real Life
Linear Regression finds applications across various domains, including:
Predictive Analytics: Predicting sales trends, stock prices, and customer behavior.
Forecasting: Forecasting demand for products, weather prediction, and resource allocation.
Challenges and Limitations of Linear Regression
Despite its widespread use, Linear Regression has its limitations:
Assumptions Violation
Violating the assumptions of linear regression can lead to biased estimates and incorrect inferences. It’s essential to check for assumptions like linearity and homoscedasticity before interpreting the results.
Overfitting
Overfitting occurs when the model captures noise in the data rather than the underlying patterns. Regularization techniques help in combating overfitting by penalizing overly complex models.
Conclusion
In conclusion, linear regression is a powerful tool for modeling the relationship between variables and making predictions. By understanding its principles, implementing it in R, and interpreting the results, analysts can derive valuable insights from their data. However, to build robust models, it’s essential to be aware of its assumptions, limitations, and improvement techniques.
Data Science in Practice: In today’s digital age, data is ubiquitous, and its effective utilization has become paramount for businesses and organizations across various industries. Data science, a multidisciplinary field, plays a crucial role in extracting valuable insights from data to drive informed decision-making and enhance business strategies.
Defining Data Science
Data science encompasses the processes and techniques involved in analyzing and interpreting complex data sets to uncover patterns, trends, and correlations. It integrates elements of statistics, computer science, and domain knowledge to extract actionable insights from raw data.
Importance in Various Industries
Data science has revolutionized industries ranging from healthcare to finance, enabling organizations to optimize operations, improve customer experiences, and innovate products and services. By leveraging data-driven approaches, businesses can gain a competitive edge in today’s dynamic market landscape.
The first step in the data science process involves gathering relevant data from various sources, including databases, sensors, social media, and IoT devices. This data may be structured, semi-structured, or unstructured and requires careful curation for meaningful analysis.
Data Cleaning and Preprocessing
Raw data often contains errors, inconsistencies, and missing values that need to be addressed before analysis. Data cleaning involves removing outliers, standardizing formats, and imputing missing values to ensure the accuracy and reliability of the dataset.
Data Analysis
Once the data is cleaned and prepared, it undergoes exploratory data analysis to identify patterns, correlations, and outliers. Techniques such as statistical analysis, data visualization, and clustering are employed to gain insights into the underlying data distribution.
Machine Learning and AI
Machine learning algorithms play a central role in predictive modeling, classification, and regression tasks within data science. By training models on historical data, organizations can make accurate predictions and automate decision-making processes.
Applications of Data Science
Healthcare
In healthcare, data science is used to analyze patient records, predict disease outbreaks, and personalize treatment plans. By leveraging electronic health records and medical imaging data, healthcare providers can improve diagnosis accuracy and patient outcomes.
Finance
In the finance industry, data science drives risk management, fraud detection, and algorithmic trading strategies. By analyzing market trends and customer behavior, financial institutions can make informed investment decisions and mitigate financial risks.
E-commerce
E-commerce companies use data science to personalize product recommendations, optimize pricing strategies, and enhance customer retention. By analyzing user browsing patterns and purchase history, e-commerce platforms can deliver targeted marketing campaigns and improve sales conversions.
Marketing
Data science enables marketers to segment audiences, measure campaign performance, and forecast customer demand. By analyzing social media data and consumer behavior, marketers can tailor marketing strategies to specific target demographics and maximize ROI.
Challenges in Implementing Data Science
Data Privacy and Security
The proliferation of data raises concerns about privacy violations and cybersecurity threats. Organizations must adhere to data protection regulations and implement robust security measures to safeguard sensitive information.
Data Quality Issues
Incomplete, inaccurate, or biased data can undermine the effectiveness of data science initiatives. Data scientists must address data quality issues through rigorous validation and cleansing processes.
Talent Shortage
The demand for skilled data scientists exceeds the supply, leading to a talent shortage in the field. Organizations face challenges in recruiting and retaining qualified professionals with expertise in data science and analytics.
Future Trends in Data Science
Advancements in AI and ML
Rapid advancements in artificial intelligence and machine learning are reshaping the landscape of data science. Breakthroughs in deep learning, natural language processing, and reinforcement learning hold promise for solving complex data challenges.
Edge Computing
Edge computing enables real-time data processing and analysis at the network edge, reducing latency and bandwidth usage. This paradigm shift has implications for IoT applications, autonomous systems, and decentralized data processing.
Ethical Considerations
As data science continues to evolve, ethical considerations surrounding data usage and algorithmic bias come to the forefront. Organizations must prioritize ethical principles such as transparency, fairness, and accountability in their data-driven decision-making processes.
Conclusion
Data Science in Practice: In conclusion, data science is pivotal in driving innovation, efficiency, and competitiveness across industries. By harnessing the power of data, organizations can unlock new opportunities for growth and address complex challenges in today’s interconnected world.
Installation: Before starting with data science, we need to install Python and some essential libraries like numpy, pandas, matplotlib, seaborn, scikit-learn, and others. You can install Python from the official website, and you can install the libraries using pip, the package installer for Python.
Data Loading: The first step in any data science project is to load the data into Python. We can load data from various sources like CSV, Excel, JSON, or SQL databases using libraries like pandas or SQLite3.
Data Exploration: After loading data, we need to explore the data to understand its characteristics, patterns, and relationships. We can use various statistical methods like mean, median, mode, standard deviation, correlation, and visualization techniques like histograms, box plots, scatter plots, and heat maps.
Data Cleaning: Data cleaning is an essential step in data science, where we remove irrelevant data, correct the missing values, remove duplicates, and transform data into a more manageable format. We can use techniques like data imputation, one-hot encoding, and feature scaling to clean the data.
Data Preprocessing: Data preprocessing involves transforming the raw data into a format suitable for machine learning models. We can use various techniques like feature selection, dimensionality reduction, and normalization to preprocess the data.
Machine Learning: Machine learning is a subfield of artificial intelligence that involves creating models that can learn from the data and make predictions or decisions. We can use various machine learning algorithms like linear regression, logistic regression, decision trees, random forests, and support vector machines to build the models.
Model Evaluation: Model evaluation involves assessing the performance of the models using various metrics, such as accuracy, precision, recall, F1 score, and confusion matrix. Techniques like cross-validation, hyperparameter tuning, and model selection can also improve model performance.
Model Deployment: Model deployment involves integrating the model into the production environment, where it can make predictions on new data. We can deploy the models as web services, APIs, or mobile applications.
Data Visualization: Data visualization is an essential aspect of data science, where we create visual representations of the data to communicate insights and findings to stakeholders. We can use various visualization libraries, such as Matplotlib, Seaborn, and Plotly, to create interactive visualizations.
Statistics plays a crucial role in modern medicine, aiding in the interpretation of data, identification of trends, and making informed decisions. With the advent of powerful computing tools like R, the application of statistics in medicine has become more accessible and efficient than ever before. In this article, we’ll explore the practical aspects of using statistics in medicine, focusing particularly on how to utilize R for statistical analysis.
Introduction to Practical Statistics in Medicine with R
Statistics forms the backbone of evidence-based medicine, guiding healthcare professionals in making informed decisions. Whether it’s assessing the efficacy of a new treatment, analyzing patient data, or understanding disease patterns, statistical methods are indispensable in the medical field. Additionally, R has emerged as a popular programming language and software environment for statistical computing and graphics, providing a wide array of tools for data analysis and visualization.
Basic Statistical Concepts
Before delving into the intricacies of statistical analysis with R, it’s essential to grasp fundamental concepts such as measures of central tendency (mean, median, mode), measures of dispersion (standard deviation, variance), and the basics of probability theory. These concepts lay the groundwork for more advanced statistical techniques and are crucial for interpreting data accurately.
One of the strengths of R lies in its powerful capabilities for data visualization. Through libraries like ggplot2, R enables users to create a variety of plots and graphs, including scatter plots, histograms, and box plots. Visualizing data not only facilitates exploratory analysis but also helps communicate findings effectively to others.
Probability Distributions in Medicine
Understanding probability distributions is fundamental in medical statistics, as many phenomena in healthcare follow specific distribution patterns. Common distributions include the normal distribution, which underpins many statistical tests, the binomial distribution, relevant for binary outcomes like success or failure in clinical trials, and the Poisson distribution, commonly used for modeling event occurrences over time.
Hypothesis Testing
Hypothesis testing is a cornerstone of inferential statistics, allowing researchers to conclude populations based on sample data. In medical research, hypothesis testing is used to assess the significance of observed differences or associations, helping validate or refute hypotheses regarding treatments, interventions, or disease outcomes.
Regression Analysis
Regression analysis is a powerful tool for exploring relationships between variables in medical data. Linear regression models can be used to predict continuous outcomes, while logistic regression is employed for binary outcomes. These techniques enable researchers to identify factors influencing patient outcomes and make predictions based on relevant variables.
Survival Analysis
Survival analysis is commonly used in medical research to analyze time-to-event data, such as patient survival times or time until disease recurrence. Techniques like Kaplan-Meier curves and the Cox proportional hazards model are widely used to assess factors affecting survival outcomes and make comparisons between different treatment groups.
Clinical Trials and Experimental Design
In clinical research, proper experimental design is essential for ensuring the validity and reliability of study findings. Concepts such as randomization, blinding, and control groups help minimize bias and confounding factors, allowing researchers to draw accurate conclusions about treatment efficacy and safety.
Meta-Analysis in Medicine
Meta-analysis involves combining data from multiple studies to derive more robust conclusions than individual studies alone. This approach is particularly valuable in synthesizing evidence from disparate sources and estimating overall treatment effects with greater precision.
Challenges and Pitfalls in Medical Statistics
Despite its benefits, medical statistics also pose several challenges, including confounding variables, publication bias, and the risk of drawing erroneous conclusions from observational data. Recognizing and addressing these pitfalls is essential for ensuring the validity and reliability of research findings.
Practical Applications of Statistics in Medicine
Statistics find numerous applications in clinical practice, from diagnostic testing and risk assessment to treatment evaluation and personalized medicine. By applying statistical methods rigorously, healthcare professionals can enhance patient care and contribute to advancements in medical science.
Ethical Considerations in Medical Research
In addition to methodological rigor, ethical considerations are paramount in medical research. Protecting patient privacy, obtaining informed consent, and ensuring data integrity are crucial aspects of conducting ethical research studies.
Resources for Learning Statistics with R
For those interested in learning statistics with R, numerous resources are available, including online courses, textbooks, and community forums. Websites like Coursera, DataCamp, and RStudio offer comprehensive courses covering various statistical topics with practical examples using R.
Case Studies and Examples
To illustrate the practical application of statistics in medicine, we’ll explore real-world case studies and examples showcasing how statistical methods and R programming have been utilized to address clinical research questions and improve patient outcomes.
Conclusion
In conclusion, practical statistics in medicine with R offers a powerful toolkit for analyzing healthcare data, identifying patterns, and making evidence-based decisions. By mastering statistical concepts and leveraging the capabilities of R, healthcare professionals can contribute to advancements in medical research and ultimately improve patient care.
Python for Programmers: Python has emerged as one of the most popular programming languages worldwide. Its simple syntax and readability make it an ideal choice for beginners and experienced programmers.
Importance of Python for Programmers
Versatility
Python is a versatile language that can be used for various applications such as web development, data analysis, artificial intelligence, machine learning, and more.
Simplicity
The simplicity of Python’s syntax allows programmers to write code efficiently and effectively. This simplicity also contributes to faster development cycles and easier maintenance.
Extensive Libraries
Python boasts a vast collection of libraries and frameworks that facilitate various tasks, ranging from data manipulation to web scraping to machine learning. These libraries enable programmers to leverage existing solutions and accelerate development.
Python for Programmers with introductory AI case studies
Python’s syntax is straightforward to understand, making it accessible to programmers of all levels. Its use of indentation for code blocks enhances readability and reduces the likelihood of syntax errors.
Data Types
Python supports various data types, including integers, floats, strings, lists, tuples, dictionaries, and more. This flexibility allows programmers to handle diverse data structures efficiently.
Variables
In Python, variables are dynamically typed, meaning they can hold values of any data type. This dynamic typing simplifies variable declaration and enhances code flexibility.
Operators
Python supports various operators, including arithmetic, comparison, logical, and assignment operators. These operators enable programmers to perform various operations on data with ease.
Python Control Structures
Conditional Statements
Python supports conditional statements such as if, elif, and else, allowing programmers to execute different blocks of code based on specific conditions.
Loops
Python provides loop constructs like for and while loops, enabling programmers to iterate over sequences and perform repetitive tasks efficiently.
Functions and Modules in Python
Functions in Python allow programmers to encapsulate reusable code blocks, enhancing code organization and modularity. Python modules further facilitate code reuse by enabling the grouping of related functions and variables.
Object-Oriented Programming (OOP) in Python
Classes and Objects
Python supports object-oriented programming paradigms, allowing programmers to create classes and objects to model real-world entities. This approach enhances code reusability and maintainability.
Inheritance
Inheritance in Python enables the creation of subclasses that inherit properties and behaviors from parent classes. This feature promotes code reuse and supports hierarchical structuring.
Polymorphism
Polymorphism in Python allows objects of different classes to be treated interchangeably, enhancing code flexibility and extensibility.
Introduction to Artificial Intelligence (AI)
Artificial intelligence (AI) refers to the simulation of human intelligence in machines, enabling them to perform tasks that typically require human intelligence, such as learning, reasoning, and problem-solving.
Python’s Role in AI Development
Python has become the de facto language for AI development due to its simplicity, extensive libraries, and vibrant community support. Its rich ecosystem of libraries such as TensorFlow, Keras, and Scikit-learn facilitates various AI tasks, including machine learning, natural language processing, computer vision, and more.
Case Study: Sentiment Analysis with Python
Problem Statement
Sentiment analysis involves determining the sentiment expressed in textual data, such as positive, negative, or neutral.
Solution with Python
Python offers powerful libraries like NLTK and TextBlob for sentiment analysis. These libraries provide pre-trained models and tools for text processing, making sentiment analysis implementation straightforward.
Code Implementation
# Importing the necessary libraries from textblob import TextBlob # Analyzing sentiment text = "Python is an amazing programming language!" blob = TextBlob(text) sentiment = blob.sentiment # Displaying sentiment print(sentiment)
Case Study: Image Recognition with Python
Problem Statement
Image recognition involves identifying and categorizing objects or patterns within images.
Solution with Python
Python’s libraries like OpenCV and TensorFlow facilitate image recognition tasks. These libraries provide pre-trained models and APIs for image processing, enabling the development of robust image recognition systems.
Code Implementation
# Importing the necessary libraries import cv2 # Loading pre-trained model model = cv2.dnn.readNetFromTensorflow('frozen_inference_graph.pb', 'ssd_mobilenet_v2_coco.pbtxt') # Performing object detection # Code implementation omitted for brevity
Conclusion
Python is a versatile and powerful programming language that plays a crucial role in various fields, including artificial intelligence. Its simplicity, extensive libraries, and strong community support make it an ideal choice for programmers seeking to develop AI solutions. We’ve demonstrated Python’s efficacy in real-world AI applications through introductory case studies in sentiment analysis and image recognition.
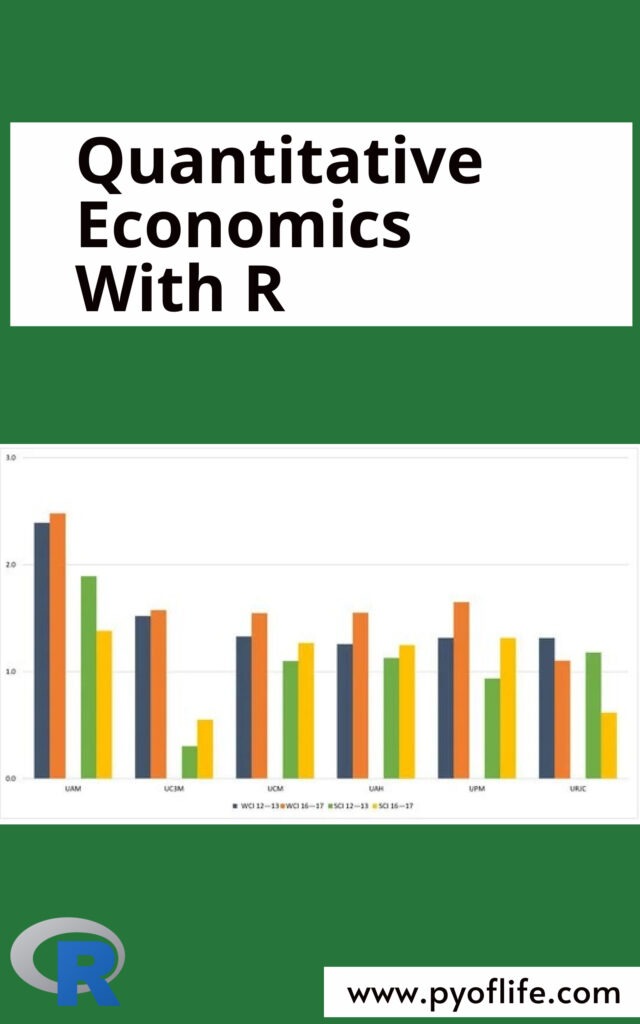
Quantitative Economics With R: Quantitative economics is a branch of economics that relies heavily on mathematical and statistical methods to analyze economic phenomena. It involves the application of mathematical models and techniques to understand economic behavior, make predictions, and formulate policies. In recent years, the field has witnessed a significant transformation with the advent of data science techniques.
Importance of Data Science in Economics
Data science has revolutionized how economists approach problems by providing tools and techniques to analyze vast amounts of data efficiently. In economics, where data collection is fundamental, data science plays a crucial role in extracting meaningful insights from complex datasets. By leveraging data science methods, economists can uncover hidden patterns, relationships, and trends that were previously inaccessible.
Overview of R Programming Language
R is a powerful programming language and environment for statistical computing and graphics. It is widely used by economists and data scientists for data analysis, visualization, and modeling. With its rich ecosystem of packages and libraries, R provides a comprehensive toolkit for quantitative analysis in economics.
One of the primary tasks in quantitative economics is data manipulation and cleaning. R provides robust tools, such as the dplyr and tidyr packages, for efficiently managing and preparing data for analysis. These packages allow economists to filter, reshape, and aggregate datasets with ease.
Statistical Analysis
R offers a wide range of statistical functions and methods for analyzing economic data. From basic descriptive statistics to advanced modeling techniques, R enables economists to conduct rigorous statistical analysis to test hypotheses and derive insights.
Predictive Modeling
Predictive modeling is another essential aspect of quantitative economics, especially in forecasting economic trends and outcomes. With R’s machine learning libraries, such as caret and randomForest, economists can build predictive models that help anticipate future developments based on historical data.
Data Visualization with R
Visualization is a powerful tool for communicating insights and findings in economics. R’s ggplot2 package allows economists to create visually appealing and informative graphs, charts, and plots to illustrate economic trends, patterns, and relationships.
Time Series Analysis in Economics Using R
Time series analysis is a fundamental technique in economics for analyzing data collected over time. R provides specialized packages, such as forecast and tseries, for time series analysis, enabling economists to model and forecast economic variables such as GDP, inflation, and unemployment.
Econometric Modeling with R
Econometric modeling involves the application of statistical methods to economic data to estimate and test economic theories. R’s lm function and other econometric packages make it easy for economists to build and evaluate econometric models, allowing them to quantify relationships between variables and assess economic policies’ impacts.
Case Studies and Examples
To illustrate the practical applications of quantitative economics with R, let’s consider a few case studies:
Stock Market Prediction: Using historical stock price data, economists can build predictive models in R to forecast future stock prices and identify profitable trading opportunities.
Consumer Behavior Analysis: By analyzing consumer spending patterns and demographic data, economists can gain insights into consumer behavior and market trends using R.
Policy Evaluation: Econometric modeling in R allows economists to evaluate the effectiveness of various economic policies, such as taxation or monetary policy, by analyzing their impacts on relevant economic indicators.
Challenges and Limitations
Despite its many advantages, quantitative economics with R also faces challenges and limitations. These may include:
Data Quality: Ensuring the quality and reliability of data used in economic analysis can be challenging, particularly when dealing with large and heterogeneous datasets.
Model Complexity: Building and interpreting complex econometric models in R requires a solid understanding of economic theory and statistical methods.
Computational Resources: Performing intensive data analysis tasks in R may require significant computational resources, limiting the scalability of analyses.
Future Trends in Quantitative Economics with R
Looking ahead, the future of quantitative economics with R is promising. Advances in machine learning, big data analytics, and computational methods are expected to further enhance economists’ ability to analyze and understand complex economic phenomena. The growing availability of open data sources and collaborative platforms will also democratize access to economic data and analysis tools.
Conclusion
Quantitative economics with R offers a powerful and versatile approach to analyzing economic data and making informed decisions. By leveraging the tools and techniques provided by R and data science, economists can gain deeper insights into economic behavior, predict future trends, and formulate more effective policies.