Have you ever wondered why some Facebook ads get lots of clicks while others barely get any attention?
Businesses spend money showing their products and services on Facebook every day. But spending more money doesn’t guarantee better results.
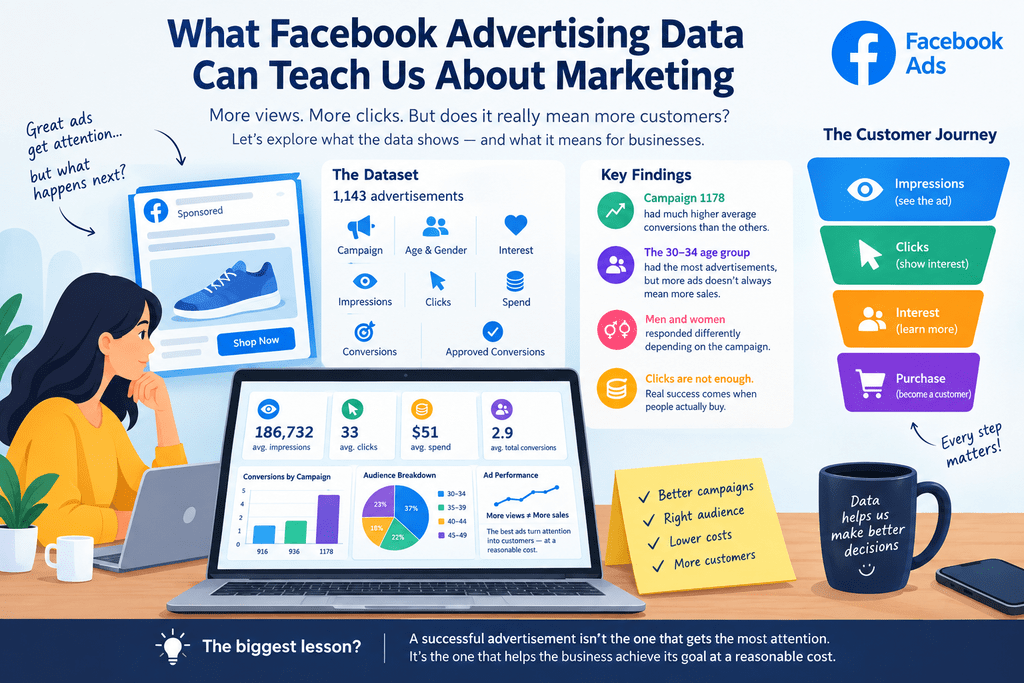
To understand this better, let’s look at a Facebook advertising dataset containing information from 1,143 advertisements.
We will look at a few simple questions:
- Which campaigns performed better?
- Which age groups were reached?
- How many people clicked on the ads?
- How much money was spent?
- How many people converted?
- What can businesses learn from this data?
The goal is not to build a complicated mathematical model. Instead, let’s use data to understand what was happening behind the advertisements.
What Information Do We Have?
Each row in the dataset represents an advertisement.
For each ad, we have information such as:
- The campaign it belonged to
- The target age group
- Gender
- Interest category
- Number of times the ad was shown
- Number of clicks
- Money spent
- Number of conversions
- Number of approved conversions
Think of it as a report card for Facebook advertisements.
First, Let’s Look at the Numbers
On average, each advertisement was shown about 186,732 times.
However, the average can be misleading because some advertisements were shown millions of times while others were shown much less.
On average, each advertisement received about 33 clicks.
The average advertising spend was about $51.
An advertisement generated around 2.9 total conversions on average, while approved conversions averaged about 0.94.
These numbers tell us something important:
Getting people to see an advertisement is much easier than getting them to take meaningful action.
That is an important lesson for any business running online advertising.
Which Campaign Did Better?
The dataset contains three main campaigns:
- Campaign 916
- Campaign 936
- Campaign 1178
When we compare their average conversions, we see a noticeable difference.
| Campaign | Average Total Conversions | Average Approved Conversions |
|---|---|---|
| 916 | 1.07 | 0.44 |
| 936 | 1.16 | 0.39 |
| 1178 | 4.27 | 1.40 |
Campaign 1178 had a much higher average number of conversions per advertisement.
That makes it interesting. But we should be careful. It would be wrong to say:
“Campaign 1178 was definitely better because it caused more sales.”
We don’t have enough information to prove that. Maybe the campaign had a different audience. Maybe it promoted a different product. Maybe it received a different budget. The data tells us that Campaign 1178 had higher conversion numbers in this dataset. It does not tell us exactly why. That’s an important difference.
What About Age?
The advertisements targeted different age groups.
The largest group in the dataset was people aged 30–34.
The other groups were:
- 35–39
- 40–44
- 45–49
There were 426 advertisements targeting people aged 30–34, making it the largest group in the dataset.
But here’s another important lesson.
Having more advertisements aimed at a particular age group doesn’t automatically mean that group is the most profitable.
Imagine a business shows:
1,000 ads to Group A
and
100 ads to Group B.
Group A will probably produce more total clicks simply because it received more exposure.
So marketers should ask:
“How efficiently did each group respond?”
rather than simply:
“Which group produced the most clicks?”
Men vs Women
The dataset contains advertisements targeting both men and women. There are 592 male observations and 551 female observations. This gives us another opportunity to compare advertising performance. But again, we shouldn’t jump to conclusions. Instead of asking:
“Are men better customers than women?”
a better question is:
“How did each audience respond to each campaign?”
A campaign might work well with one audience but poorly with another. This is why businesses often divide their customers into smaller groups instead of treating everyone the same.
Impressions Don’t Mean Sales
One of the biggest lessons from advertising data is that attention is not the same as success. An advertisement can be seen hundreds of thousands of times. People might even click on it. But if nobody buys the product, the business may still lose money. Think about a simple example.
Imagine you spend $100 on an advertisement.
It gets:
100,000 views
2,000 clicks
but only:
1 purchase
At first glance, the advertisement looks impressive.
100,000 views sounds great.
2,000 clicks sound great.
But if the product only generated one purchase, the business needs to ask whether that $100 was worth spending. That’s why businesses need to follow the entire customer journey:
Views → Clicks → Interest → Purchase
Clicks Are Not Enough
A common mistake in digital marketing is focusing too much on clicks. Clicks are useful, but they are only one part of the story. For example:
Ad A
10,000 people see it
500 people click
5 people buy
Ad B
5,000 people see it
200 people click
20 people buy
Ad A gets more clicks.
But Ad B generates more purchases.
So which advertisement should the business investigate further?
The answer cannot be determined from clicks alone.
We need to look at what happens after the click.
What Is CTR?
One simple measurement marketers use is Click-Through Rate, or CTR. It answers a simple question:
“Out of all the people who saw the advertisement, how many clicked it?”
The calculation is:
CTR = Clicks ÷ Impressions × 100
For example, if an advertisement is shown 10,000 times and receives 200 clicks:
CTR = 200 ÷ 10,000 × 100 = 2%
This tells us that 2 out of every 100 impressions resulted in a click.
CTR is useful for understanding how attractive an advertisement is to its audience.
But it still doesn’t tell us whether people bought anything.
What About Advertising Cost?
Businesses also need to know how much they are paying for each result. One simple measurement is Cost Per Click (CPC).
For example:
If a business spends $50 and receives 100 clicks:
CPC = $50 ÷ 100 = $0.50
So each click costs an average of 50 cents. But again, cheap clicks aren’t necessarily good clicks. If those 100 clicks produce zero customers, the business hasn’t achieved much.
The Most Important Number May Be the Final Conversion
For many businesses, the final goal isn’t:
“How many people clicked?”
It’s:
“How many people became customers?”
That’s why conversion data is so important. A simple advertising funnel looks like this:
People see the ad
↓
Some people click
↓
Some people become interested
↓
Some people purchase
At every stage, some people disappear from the funnel. The job of marketing analytics is to understand where that happens.
What Can Businesses Learn From This?
This dataset gives us several useful lessons.
1. More views don’t automatically mean more sales
A popular advertisement can still perform poorly if people don’t take action.
2. More clicks don’t automatically mean more customers
Clicks are only one step in the buying process.
3. Different campaigns can perform very differently
The campaigns in this dataset show clear differences in average conversion numbers.
4. Different audiences can respond differently
Age, gender, and interests can influence how people respond to advertisements.
5. Businesses should look at costs
Getting customers is important, but businesses also need to consider how much they spent to get them.
One Important Warning About Data
There is one thing we should always remember when analyzing marketing data:
Data can show us what happened, but it doesn’t always tell us why it happened.
For example, Campaign 1178 had higher average conversions in this dataset. But we don’t know whether that happened because of:
- Better advertising
- Better targeting
- A better product
- A larger budget
- A different audience
- Better timing
- Or something else
To answer those questions properly, we would need more information. This is why good data analysis should avoid making claims that the data cannot support.
Final Thoughts
Facebook advertising produces a huge amount of information. But businesses don’t need to look at every number at once. Start with a few simple questions:
How many people saw the ad?
How many clicked?
How much did we spend?
How many people converted?
How much did each customer cost us?
Once we understand these numbers, we can start asking deeper questions about campaigns and audiences. The biggest lesson from this analysis is simple:
A successful advertisement isn’t necessarily the one that gets the most attention. It’s the one that helps the business achieve its goal at a reasonable cost.
That is where data analytics becomes useful. Instead of guessing which advertisement is working, businesses can use their data to understand what happened and make better-informed marketing decisions.