An Introduction to Financial Data Analysis with R: Financial data analysis is an important part of any financial decision-making process. With the rise of big data and advanced analytics, the ability to analyze financial data has become crucial for businesses, governments, and other organizations. R provides a powerful platform for financial data analysis. Whether working with time series data, regression analysis, or machine learning. With the right data and the right tools, you can make informed financial decisions based on your data analysis. In this article, we will cover the basics of financial data analysis in R and provide some practical examples with real data.
To get started with R, you will need to download and install the software. You can download R from the official website. Once you have installed R, you can use the software to analyze financial data.
The first step in financial data analysis is to import the data into R. R provides several functions for importing data, including read.csv and read.table. For example, to import a CSV file into R, you can use the following code:
financial_data <- read.csv("financial_data.csv")
Once you have imported the data into R, you can start exploring the data using various R functions. For example, you can use the head function to see the first few rows of the data:
head(financial_data)
Exploring Financial Data in R
Once you have imported the data into R, you can start exploring the data. The first step in this process is to get a sense of the overall structure of the data. You can use the str function to see the structure of the data:
str(financial_data)
Next, you can use the summary function to see a summary of the data:
summary(financial_data)
The summary function will give you information about the mean, median, and standard deviation of the data.
Data Visualization in R
Data visualization is an important part of financial data analysis. R provides many functions for visualizing data, including histograms, scatter plots, and line charts.
For example, you can use the hist function to create a histogram of the data:
hist(financial_data$returns)
You can also use the plot function to create a scatter plot of the data:
Once you have explored the data and visualized the data, you can start analyzing the data. There are many techniques for financial data analysis, including regression analysis, time series analysis, and machine learning.
For example, you can use the lm function to perform a linear regression analysis:
model <- lm(returns ~ price, data = financial_data)
summary(model)
You can also use the arima function to perform a time series analysis:
model <- arima(financial_data$returns, order = c(1, 1, 0))
summary(model)
Welcome to the exciting world of machine learning, where computers learn and improve without explicit programming. In this article, we’ll delve deep into the foundations of machine learning, demystifying the core principles that underpin this revolutionary technology. Whether you’re a novice or a seasoned pro, there’s something here for everyone. So, let’s embark on this journey to unravel the mysteries of machine learning.
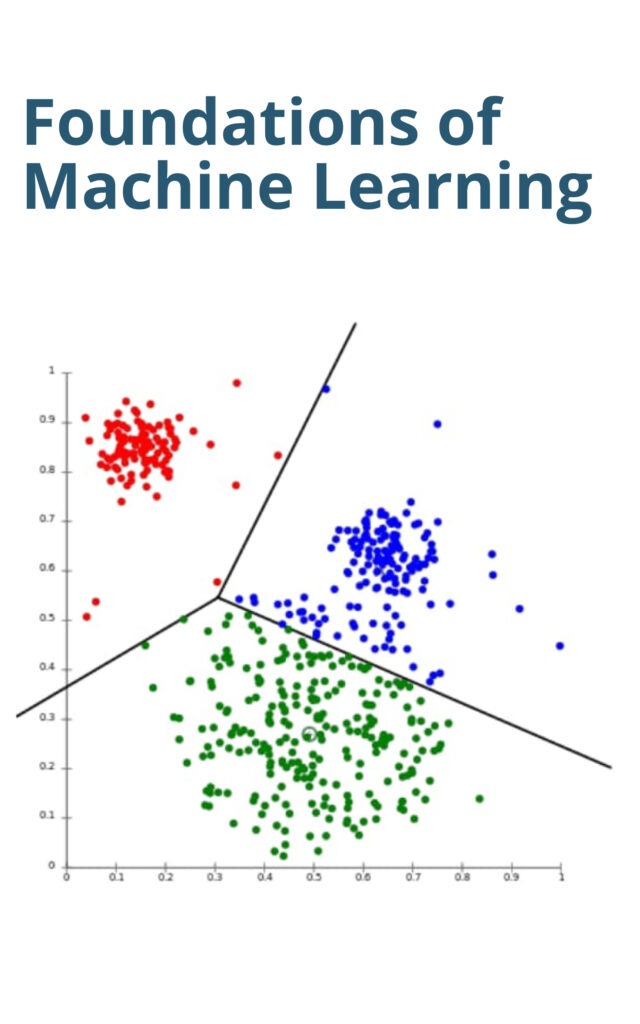
Foundations of Machine Learning
The Beginnings
Machine learning, often referred to as ML, represents a branch of artificial intelligence (AI) that focuses on the development of algorithms and statistical models. These algorithms enable computers to learn and make predictions or decisions without being explicitly programmed. The foundations of machine learning are rooted in mathematics, statistics, and computer science.
ML has evolved from the idea of creating computer systems that can automatically improve their performance through experience. Arthur Samuel, a pioneer in the field, coined the term “machine learning” in 1959, laying the groundwork for what we know today.
At the heart of machine learning is data. Enormous datasets serve as the fuel that powers ML algorithms. These datasets are used to train models, allowing them to recognize patterns and make predictions. The more high-quality data you have, the better your machine-learning model can perform.
2. Algorithms
ML algorithms are the brains behind the operation. These complex mathematical models process the data and adjust themselves to improve their performance over time. Common ML algorithms include decision trees, neural networks, and support vector machines.
3. Model Training
Training a machine learning model involves feeding it with labeled data, which means data with known outcomes. The model then learns from this data to predict new, unlabeled data. This iterative process is what enables machines to learn and improve.
4. Feature Engineering
Feature engineering is the art of selecting and transforming the most relevant attributes or features from your data. It’s a critical step in the ML pipeline as it directly impacts the model’s performance.
Applications
Machine learning has found applications in various domains, revolutionizing industries and enhancing our daily lives. Some notable applications include:
Natural Language Processing (NLP): ML powers chatbots, translation services, and sentiment analysis in language processing.
Healthcare: ML aids in disease diagnosis, drug discovery, and personalized treatment plans.
Finance: Fraud detection, algorithmic trading, and credit scoring rely heavily on ML.
Autonomous Vehicles: ML algorithms enable self-driving cars to perceive and navigate the world.
FAQs
How do machine learning models make predictions?
Machine learning models make predictions by learning patterns from labeled data during the training phase. Once trained, they apply this knowledge to new, unlabeled data to make predictions or classifications.
Is machine learning the same as artificial intelligence?
No, machine learning is a subset of artificial intelligence. AI encompasses a broader range of concepts, while machine learning specifically focuses on algorithms and statistical models that enable computers to learn and make predictions.
What are some challenges in machine learning?
Challenges in machine learning include data quality issues, overfitting (when a model performs well on training data but poorly on new data), and ethical considerations surrounding bias in algorithms.
Can I start learning machine learning without a background in programming?
While some programming knowledge is beneficial, you can start learning machine learning with the right resources and determination. Many online courses and tutorials cater to beginners in this field.
Are there any ethical concerns in machine learning?
Ethical concerns in machine learning include issues related to bias in algorithms, data privacy, and the potential for automation to displace jobs. It’s essential to address these concerns as the field continues to advance.
What’s the future of machine learning?
The future of machine learning holds endless possibilities. As technology continues to advance, ML will play a pivotal role in solving complex problems, driving innovation, and reshaping industries across the globe.
Conclusion
In this journey through the foundations of machine learning, we’ve explored the key concepts, applications, and some common FAQs that shed light on this dynamic field. As machine learning continues to evolve, it promises to transform industries, making our lives more efficient and enjoyable. Embrace the future of AI by understanding its foundations, and you’ll be well-prepared for the exciting developments yet to come.
Python programming has emerged as one of the most popular languages for data analysis, thanks to its simplicity and flexibility. It is an open-source, object-oriented programming language widely used for various tasks, including building web applications and scientific computing. In this article, we will cover the basics of Python programming for data analysis.
Setting up Python Environment for Data Analysis
Before we start exploring Python for data analysis, we need to set up our environment. We will need to install Python and several libraries that are commonly used in data analysis, such as Numpy, Pandas, Matplotlib, and Seaborn. These libraries can be installed using the pip command in the terminal or command prompt.
Python supports several data types, including numeric data types, strings, lists, tuples, sets, and dictionaries. Numeric data types include integers, floating-point numbers, and complex numbers. Strings are used to represent text data, while lists, tuples, sets, and dictionaries are used to store collections of data.
Reading and Writing Data with Python
Python provides several libraries for reading and writing data in different formats. For instance, we can read and write CSV files using the built-in csv module, which provides several functions for working with CSV files. Similarly, we can read and write Excel files using the pandas library.
Python provides several libraries that are specifically designed for data analysis, such as Numpy and Pandas. Numpy provides support for mathematical operations, while Pandas provides support for data manipulation and analysis. With these libraries, we can perform a variety of data analysis tasks, such as data cleaning, preprocessing, and visualization.
Python offers several libraries for data visualization, including Matplotlib and Seaborn. Matplotlib provides support for basic visualization, while Seaborn provides support for advanced visualization. With these libraries, we can create a variety of visualizations, such as bar charts, line charts, scatter plots, and heat maps.
Welcome to the world of Tidy Modeling with R – A Framework for Modeling in the Tidyverse. In this comprehensive guide, we will explore this powerful approach to data modeling, providing you with a complete understanding of the topic. Whether you’re a data scientist or just curious about data modeling, this article will equip you with the knowledge you need.
What is Tidy Modeling with R?
Tidy Modeling with R is a data modeling approach that leverages the capabilities of the Tidyverse ecosystem in R. It offers a structured and efficient way to work with data, allowing for seamless modeling and visualization. This framework has gained immense popularity in the data science community for its simplicity and effectiveness.
Tidy Modeling with R: A Framework for Modeling in the Tidyverse
In this section, we will delve into the fundamental aspects of Tidy Modeling with R, including:
Data Cleaning and Transformation
Learn how to prepare your data for modeling by applying essential cleaning and transformation techniques.
Data Visualization
Discover the art of visualizing data with the Tidyverse, making it easier to identify patterns and insights.
Model Building
Explore the process of building predictive models using Tidy Modeling techniques, optimizing your results.
Model Evaluation
Understand how to assess the performance of your models and make informed decisions based on the evaluation metrics.
Tidy Modeling with R in Practice
Now that we’ve covered the foundations, let’s see how Tidy Modeling is applied in real-world scenarios. We will discuss:
Predictive Analytics
Learn how to use Tidy Modeling to predict future trends and outcomes, with practical examples.
Classification
Discover how Tidy Modeling addresses classification problems, enabling accurate data categorization.
Regression Analysis
Delve into the world of regression analysis with Tidy Modeling, modeling relationships between variables.
Time Series Forecasting
Discover how Tidy Modeling is used in time series forecasting, a crucial component in various industries.
FAQs (Frequently Asked Questions)
Is Tidy Modeling suitable for beginners?
Absolutely! Tidy Modeling with R is designed to be beginner-friendly, and its logical structure makes it accessible to those new to data modeling.
Are there any prerequisites for learning Tidy Modeling?
While prior knowledge of R programming is beneficial, this framework can be learned by anyone with a keen interest in data science.
Can Tidy Modeling handle large datasets?
Yes, Tidy Modeling can handle large datasets efficiently, thanks to its optimization capabilities within the Tidyverse.
What are the advantages of Tidy Modeling over traditional modeling approaches?
Tidy Modeling provides a more streamlined and intuitive approach to data modeling, facilitating easier data manipulation and the creation of accurate models.
Are there any online resources for learning Tidy Modeling?
Certainly! There are numerous online courses and tutorials dedicated to Tidy Modeling, making it accessible to learners worldwide.
How can I get started with Tidy Modeling today?
To embark on your Tidy Modeling journey, you can start by installing the Tidyverse package in R and exploring online resources and tutorials.
Conclusion
In conclusion, Tidy Modeling with R – A Framework for Modeling in the Tidyverse is a game-changer in the field of data modeling. It simplifies the process, making it accessible to both beginners and experienced data scientists. With its robust capabilities, Tidy Modeling empowers you to extract valuable insights from your data efficiently.
Unlock the potential of Tidy Modeling with R and elevate your data modeling skills to new heights. Start your journey today and embrace the power of the Tidyverse.
New Approach to Regression with R: Regression analysis is one of the most commonly used techniques in data analysis. It is a powerful tool for predicting outcomes and understanding the relationship between variables. However, the traditional approach to regression analysis has limitations that have led to the development of new techniques. In this article, we will explore a new approach to regression with R that addresses these limitations.
Introduction
In this section, we will introduce the topic of regression analysis and its importance in data analysis. We will also discuss the limitations of the traditional approach to regression analysis.
What is regression analysis?
Regression analysis is a statistical technique used to explore the relationship between a dependent variable and one or more independent variables. It is used to predict the value of the dependent variable based on the values of the independent variables.
Regression analysis is an important tool in data analysis because it helps us understand the relationship between variables. It can be used to predict outcomes and identify important factors that affect the outcome.
Limitations of the traditional approach to regression analysis
The traditional approach to regression analysis has limitations that can make it difficult to interpret the results. One of the main limitations is that it assumes a linear relationship between the dependent variable and independent variables. This means that the relationship between variables is assumed to be constant across all values of the independent variables. Another limitation is that it assumes that the errors are normally distributed.
The new approach to regression with R
In this section, we will introduce the new approach to regression with R that addresses the limitations of the traditional approach. We will also discuss the benefits of using this approach.
Non-linear regression
The new approach to regression with R allows for non-linear relationships between the dependent variable and independent variables. This means that the relationship between variables can change depending on the values of the independent variables. Non-linear regression models are more flexible than linear regression models and can provide a better fit to the data.
Generalized linear models
The new approach to regression with R also includes generalized linear models. Generalized linear models allow for non-normal distributions of the errors. This means that the errors can be skewed or have heavy tails. Generalized linear models are more flexible than linear regression models and can provide a better fit to the data.
Bayesian regression
The new approach to regression with R also includes Bayesian regression. Bayesian regression allows us to incorporate prior knowledge into the analysis. This can be useful when we have some knowledge about the relationship between variables before we start the analysis. Bayesian regression can also provide more accurate predictions than traditional regression models.
Benefits of the new approach
The new approach to regression with R has several benefits over the traditional approach. It allows for non-linear relationships between variables, non-normal distributions of errors, and the incorporation of prior knowledge into the analysis. This makes it a more flexible and accurate tool for data analysis.
Create Graphical User Interfaces with Python: Python, a language known for its simplicity and versatility, is not only a favorite among developers but also an excellent choice for creating Graphical User Interfaces (GUIs). Whether you’re a seasoned programmer or a novice looking to dive into GUI development, Python has got you covered. In this comprehensive guide, we will explore the world of GUIs in Python, step by step, helping you unleash your creativity and turn your ideas into visually appealing and user-friendly applications.
Create Graphical User Interfaces with Python
Python’s rich ecosystem offers several libraries and frameworks for GUI development, making it a top choice for developers worldwide. Let’s dive right into the heart of this guide:
Understanding the Basics
What is a Graphical User Interface?
A Graphical User Interface, commonly known as a GUI, is a visual way for users to interact with a computer program. Instead of typing commands, users can simply click buttons, drag elements, and manipulate graphical objects to perform tasks.
Why Choose Python for GUI Development?
Python’s popularity and ease of use make it an ideal choice for GUI development. Its extensive libraries, like Tkinter, PyQt, and Kivy, provide powerful tools to create stunning interfaces effortlessly.
Tkinter is Python’s standard GUI library that comes bundled with most Python installations. It offers a simple way to create windows, dialogs, buttons, and more.
Setting Up Tkinter
Before diving into GUI development with Tkinter, ensure you have Python installed on your system. Then, follow these simple steps:
Import Tkinter: Start by importing Tkinter into your Python script.
Create a Window: Initialize the main application window.
Adding Widgets: Populate the window with widgets like buttons, labels, and entry fields.
Handling Events: Define functions to handle user interactions, such as button clicks.
Building Your First GUI Application
Step-by-Step Guide to a Simple Calculator
Let’s create a basic calculator application to get hands-on experience with Tkinter.
# Define button click function def handle_click(text): current = entry.get() if text == '=': try: result = eval(current) entry.delete(0, tk.END) entry.insert(tk.END, result) except Exception as e: entry.delete(0, tk.END) entry.insert(tk.END, "Error") else: entry.insert(tk.END, text)
Now you have a functional calculator GUI application. This example demonstrates the simplicity and power of Tkinter for creating GUIs in Python.
Exploring Advanced GUI Frameworks
Taking GUI Development to the Next Level
While Tkinter is excellent for simple applications, Python offers more advanced GUI frameworks for complex projects:
PyQt:
PyQt is a set of Python bindings for the Qt application framework.
It offers a comprehensive range of features, including support for 2D vector graphics and 3D graphics utilizing OpenGL.
Kivy:
Kivy is an open-source Python library for developing multitouch applications.
It’s highly suitable for creating touch-friendly interfaces on various platforms.
Tips and Tricks for GUI Development
Mastering the Art of GUI Design
Creating visually appealing and user-friendly GUIs requires more than just coding skills. Here are some tips and tricks to enhance your GUI development:
1. Plan Your Interface:
Before you start coding, sketch a layout and user flow to ensure a clear and intuitive interface.
2. Keep it Simple:
Avoid clutter and excessive elements. A clean design is often more effective.
3. Responsiveness Matters:
Ensure that your GUI works seamlessly on different screen sizes and resolutions.
4. Use Icons and Graphics:
Icons and graphical elements can improve user understanding and engagement.
5. Test Thoroughly:
Test your GUI with potential users to gather feedback and make improvements.
FAQs
Answering Your Burning Questions
How long does it take to learn GUI development with Python?
Learning the basics of GUI development with Python can take a few weeks to a couple of months, depending on your prior programming experience. Mastery comes with practice and project-based learning.
Is Python suitable for game development with GUIs?
Yes, Python can be used for game development with GUIs. Libraries like Pygame and Kivy are popular choices for creating games with graphical interfaces.
Are there any online resources for learning GUI development with Python?
Yes, there are plenty of online tutorials, courses, and documentation available for learning GUI development with Python. Websites like Coursera, edX, and Python.org offer valuable resources.
Can I create mobile apps with Python and GUIs?
Yes, you can create mobile apps with Python using frameworks like Kivy and BeeWare. These frameworks allow you to develop cross-platform apps for Android and iOS.
What are some popular software applications developed with Python GUIs?
Python has been used to develop various applications, including web browsers (like Chrome), 3D modeling tools (Blender), and image editing software (GIMP).
What are the career prospects for GUI developers?
GUI development is a valuable skill in today’s tech industry. GUI developers are in demand for creating user-friendly software applications, websites, and mobile apps.
Conclusion
In this comprehensive guide, we’ve explored the fascinating world of creating Graphical User Interfaces with Python. From understanding the basics to building your first GUI application and exploring advanced frameworks, you now have the knowledge and tools to embark on your GUI development journey.
Remember, GUI development is not just about coding; it’s about creating an exceptional user experience. So, plan, design, and code with passion. Your creativity knows no bounds, and with Python, the possibilities are endless. So, go ahead and create your GUI ideas with Python!
In today’s data-driven world, the ability to convey complex information effectively is paramount. That’s where “Mastering Shiny” comes into play. This innovative tool is a game-changer for data professionals and storytellers alike, enabling them to craft compelling and interactive data visualizations. In this comprehensive guide, we will explore the ins and outs of Mastering Shiny, helping you unlock its full potential and elevate your data storytelling skills.
Getting Started with Mastering Shiny
Mastering Shiny is not just a tool; it’s a gateway to creating dynamic, user-friendly applications for data visualization. Here’s a breakdown of how to embark on your journey:
The Basics of Mastering Shiny
To master Shiny, you need a solid grasp of its foundational elements. This includes understanding reactive programming, Shiny UI components, and server functions. Dive deep into each of these aspects to build a strong foundation.
Creating Your First Shiny App
The best way to learn is by doing. Let’s create your first Shiny app together. We’ll guide you through the process step by step, from setting up your environment to deploying your app for the world to see.
Shiny isn’t just about creating flashy visualizations; it’s a powerful tool for data analysis, too. Here’s how you can leverage its capabilities:
Interactive Data Exploration
With Shiny, you can dynamically explore your datasets. We’ll show you how to build interactive widgets that allow users to filter and manipulate data on the fly, gaining insights like never before.
Real-time Dashboards
Mastering Shiny enables you to create real-time dashboards that display crucial metrics and updates as they happen. We’ll teach you the tricks to make your dashboards informative and visually appealing.
Advanced Techniques and Tips
To truly become a Shiny master, you need to go beyond the basics. Here are some advanced techniques and tips:
Customizing Your Shiny Apps
Learn how to add your personal touch to Shiny apps by customizing the appearance and behavior to suit your specific needs and branding.
Deployment and Scalability
Discover the best practices for deploying Shiny apps to ensure they run smoothly and efficiently, even under heavy user loads.
Extending Shiny with R Packages
Explore how you can extend Shiny’s functionality by incorporating R packages. We’ll introduce you to some must-have packages for supercharging your Shiny apps.
FAQs
What is Mastering Shiny?
Mastering Shiny is the process of becoming proficient in using the Shiny framework to create interactive and dynamic data visualizations and applications.
How can I get started with Shiny?
To get started with Shiny, you can install the Shiny package in R and explore online resources and tutorials. Additionally, you can refer to our guide for a comprehensive introduction.
Can I use Shiny for data analysis?
Absolutely! Shiny is not just for creating visualizations; it’s a powerful tool for data analysis, allowing you to build interactive data exploration tools and real-time dashboards.
Are there any limitations to Shiny?
While Shiny is incredibly versatile, it may have performance limitations for extremely complex applications. However, with proper optimization, you can overcome most challenges.
Is Shiny suitable for beginners?
Yes, Shiny is beginner-friendly, especially when you follow structured tutorials and guides. Start with the basics and gradually progress to more advanced features.
Where can I find support and resources for Shiny?
You can find a vibrant community of Shiny users and developers online. Additionally, there are numerous books, courses, and forums dedicated to Shiny.
Conclusion
Mastering Shiny is your ticket to becoming a data storytelling virtuoso. With its ability to create stunning, interactive visualizations and robust data analysis tools, Shiny is an indispensable tool for anyone working with data. Dive into the world of Shiny, practice your skills, and unlock the true potential of data storytelling.
Regression models for data science in R: Regression analysis is one of the most widely used statistical techniques in data science, playing a crucial role in understanding the relationship between a dependent variable and one or more independent variables. In this article, we’ll explore regression models in R and discuss how they can be used to analyze and interpret data. What is Regression Analysis? Regression analysis is a statistical method used to study the relationship between a dependent variable and one or more independent variables. It is used to identify the strength and direction of the relationship between these variables and to predict future values of the dependent variable based on the values of the independent variables.
Types of Regression Analysis. There are many types of regression analysis, but the most commonly used ones are linear regression, logistic regression, and polynomial regression.
Linear Regression: Linear regression is the simplest type of regression analysis and is used to analyze the relationship between a dependent variable and one independent variable. The goal of linear regression is to find the best-fit line that describes the relationship between the two variables. The line is defined by a slope and an intercept and is given by the equation y = mx + b, where y is the dependent variable, x is the independent variable, m is the slope, and b is the intercept.
Logistic Regression: Logistic regression is used when the dependent variable is categorical. It is used to predict the probability of an event occurring based on the values of the independent variables. The output of logistic regression is a probability value between 0 and 1, which can be converted to a binary decision based on a threshold value.
Polynomial Regression: Polynomial regression is used when the relationship between the dependent and independent variables is not linear. In this case, a polynomial function is used to describe the relationship between the two variables.
Regression Models in R R is a popular language for statistical computing and is widely used in data science. It features numerous built-in functions for performing various types of regression analysis, including linear regression, logistic regression, and polynomial regression.
Linear Regression in R To perform linear regression in R, we use the lm() function. The function takes two arguments, the dependent variable and the independent variable. For example, to perform linear regression on a dataset called “data”, with the dependent variable “y” and the independent variable “x”, we would use the following code:
model <- lm(y ~ x, data = data)
This creates a linear regression model called “model” based on the data in “data”. We can then use the summary() function to display a summary of the model, including the coefficients, intercept, and standard error.
Logistic Regression in R To perform logistic regression in R, we use the glm() function. The function takes two arguments, the dependent variable and the independent variables. For example, to perform logistic regression on a dataset called “data”, with the dependent variable “y” and the independent variables “x1” and “x2”, we would use the following code:
model <- glm(y ~ x1 + x2, data = data, family = binomial)
This creates a logistic regression model called “model” based on the data in “data”. We can then use the summary() function to display a summary of the model, including the coefficients, intercept, and standard error.
Polynomial Regression in R To perform polynomial regression in R, we use the poly() function to generate a polynomial function based on the independent variable. For example, to perform polynomial regression on a dataset called “data”, with the dependent variable “y” and the independent variable “x”, we would use the following code:
polyfit <- lm(y ~ poly(x, 3), data = data)
This creates a polynomial regression model called “polyfit” based on the data.
Introduction to Deep Learning: In today’s fast-paced world, technology is evolving at an unprecedented rate. One of the most exciting and transformative fields within technology is deep learning. Deep learning has not only revolutionized artificial intelligence but has also permeated various aspects of our daily lives. In this article, we will take a journey through the fascinating world of deep learning, starting from its logical calculus roots and progressing to its current applications in artificial intelligence.
Understanding the Basics of Deep Learning
The Foundation: Artificial Neural Networks
At the heart of deep learning lies the concept of artificial neural networks (ANNs). These networks are inspired by the structure and function of the human brain. ANNs consist of layers of interconnected nodes, or neurons, which process and transmit information. This hierarchical structure allows for complex computations and pattern recognition.
Introduction to Deep Learning: From Logical Calculus to Artificial Intelligence
Deep learning traces its origins to logical calculus, a branch of mathematics concerned with formal logic and deduction. Logical calculus provided the groundwork for developing algorithms that mimic human decision-making processes.
Evolution of Deep Learning (H1)
From Perceptrons to Convolutional Neural Networks
The journey of deep learning began with the invention of perceptrons, the simplest form of artificial neural networks. Over the years, researchers developed more sophisticated architectures, such as convolutional neural networks (CNNs), which excel in image recognition tasks.
The Rise of Recurrent Neural Networks
Another significant milestone was the introduction of recurrent neural networks (RNNs). RNNs are designed to work with sequential data, making them indispensable in applications like natural language processing and speech recognition.
Deep Learning in Action
Image Recognition
Deep learning has made remarkable strides in image recognition. From identifying objects in photographs to medical image analysis, deep learning models have achieved human-level accuracy in various domains.
Natural Language Processing
In the realm of natural language processing (NLP), deep learning has empowered machines to understand and generate human language. Chatbots, language translation, and sentiment analysis are some of the applications benefiting from NLP.
Challenges and Limitations
Overfitting and Data Requirements
One of the challenges in deep learning is overfitting, where models perform well on training data but fail to generalize to new data. Addressing this issue often requires vast amounts of labeled data.
Computational Resources
Training deep learning models can be computationally intensive, requiring powerful hardware and significant energy consumption. This limitation is a concern in terms of sustainability.
The Future of Deep Learning
Explainable AI
As deep learning becomes more prevalent, the need for understanding model decisions grows. The future of deep learning includes developing more explainable AI systems to build trust and transparency.
Integration with Other Technologies
Deep learning is poised to integrate with other emerging technologies like blockchain and augmented reality, leading to innovative applications we can only begin to imagine.
Conclusion
In conclusion, deep learning has come a long way, from its roots in logical calculus to becoming a driving force behind artificial intelligence. Its ability to handle complex tasks like image recognition and natural language processing has transformed industries and opened up new possibilities. However, challenges like overfitting and resource requirements must be addressed as we continue to harness the power of deep learning.
FAQs (Introduction to Deep Learning)
What is the difference between deep learning and traditional machine learning? Deep learning is a subset of machine learning that focuses on neural networks with multiple layers, allowing it to learn complex patterns and representations.
How does deep learning benefit healthcare? Deep learning aids in medical image analysis, disease diagnosis, and drug discovery, improving patient care and outcomes.
Are there any ethical concerns related to deep learning? Yes, deep learning raises ethical concerns, particularly in areas like privacy, bias, and job displacement.
Can I get started with deep learning as a beginner? Yes, numerous online resources and courses cater to beginners interested in exploring deep learning.
What are some practical applications of deep learning in everyday life? Deep learning is used in applications such as virtual assistants, recommendation systems, and autonomous vehicles, enhancing user experiences and convenience.
Step-by-Step Guide To Analyses of Complex Survey Data in R: Analyzing complex survey data can be a daunting task, but with the right tools and guidance, it becomes manageable. This step-by-step guide will explore the intricacies of analyzing complex survey data using the powerful R programming language. Whether you’re a seasoned statistician or a novice researcher, this article will provide you with valuable insights and techniques to harness the potential of your survey data.
Getting Started with R
Before we delve into the specifics of complex survey data analysis, let’s ensure you have the necessary tools in place:
Installing R
To begin, you need to install R on your computer. Visit the official R website and download the version suitable for your operating system.
Installing RStudio
RStudio is a user-friendly integrated development environment (IDE) for R. It makes coding and data analysis more efficient. Download RStudio here.
Loading Necessary Libraries
In R, libraries enhance functionality. To perform complex survey data analysis, you must load specific libraries like “survey” and “srvyr.” You can do this with the following command:
To begin analyzing complex survey data in R, you must import your survey data into the environment. Common formats for survey data include CSV, Excel, and SPSS. Here’s a step-by-step process:
Load Data: Use the read.csv() function to import your survey data. For example:
survey_data <- read.csv("your_survey_data.csv")
Create Survey Design Object: Define your survey design using the svydesign() function. This object will store information about your survey’s stratification, clusters, and sampling weights:
Before diving into analysis, it’s essential to explore your survey data thoroughly. This step helps you understand the variables, their distributions, and potential outliers. Here’s what you should do:
Descriptive Statistics
Summary Statistics: Obtain summary statistics for your variables using the summary() function.
summary(survey_data$variable_name)
Histograms: Visualize the distribution of continuous variables with histograms.
hist(survey_data$continuous_var)
Bar Plots: Create bar plots to visualize categorical variables.
barplot(table(survey_data$categorical_var))
Preparing Data for Analysis
Handling Missing Data
Missing data can skew your analysis results. Use the na.omit() function to remove rows with missing values:
survey_data <- na.omit(survey_data)
Variable Transformation
Depending on your research questions, you may need to transform variables. Common transformations include log transformation or standardization:
Chi-Square Tests: Conduct chi-square tests to assess associations between categorical variables:
chisq.test(survey_data$var1, survey_data$var2)
Visualization
Visualizations are powerful tools for conveying your survey data’s insights. Use R’s ggplot2 package to create captivating plots
library(ggplot2) # Create a scatter plot ggplot(survey_data, aes(x = variable1, y = variable2)) + geom_point() + labs(x = "Variable 1", y = "Variable 2", title = "Scatter Plot")
FAQs
Can I use R for complex survey data analysis if I’m a beginner?
Absolutely! R is a versatile tool, and with practice and resources, beginners can become proficient in complex survey data analysis.
How do I handle missing data in my survey dataset?
You can handle missing data by using functions like na.omit() or imputing missing values based on specific methods.
What are sampling weights, and why are they important?
Sampling weights account for the unequal probabilities of selection in complex survey designs. They are crucial for obtaining unbiased estimates.
Are there any online courses or tutorials for learning complex survey data analysis in R?
Yes, there are many online courses and tutorials available on platforms like Coursera, edX, and YouTube that can help you learn complex survey data analysis in R.
Can I perform advanced statistical analyses like regression in R for complex survey data?
Yes, R offers various functions and packages for advanced statistical analyses, including regression, for complex survey data.
Where can I find more resources and documentation on R for survey data analysis?
The R documentation and websites like Stack Overflow, Cross Validated, and R-bloggers are excellent resources for R-related questions and tutorials.
Conclusion
In this comprehensive guide, we’ve walked you through the step-by-step process of analyzing complex survey data using R. From setting up your environment to performing advanced statistical analyses, you now have the tools and knowledge to tackle even the most intricate survey datasets. Remember to practice and explore the vast R ecosystem to enhance your skills further.