Data science, an interdisciplinary field that combines domain expertise, programming skills, and statistical knowledge, has gained immense significance in today’s information-driven world. R, a versatile programming language and environment, is a powerful tool for conducting data analysis, visualization, and modeling. In this article, we delve into the world of data science in R through a case studies approach, uncovering its role in enhancing computational reasoning and problem-solving abilities.
Data Science in R: An Overview
Data science in R involves the extraction of meaningful insights from large datasets using statistical techniques and algorithms. This approach allows us to uncover patterns, trends, and correlations that can drive informed decision-making across various domains.
Case Studies: Real-world Applications
Customer Segmentation for E-commerce
In this case study, we explore how data science in R can be employed for customer segmentation in the e-commerce industry. By analyzing customer behavior, purchase history, and demographic information, businesses can categorize their customers into distinct segments. These segments can then be targeted with personalized marketing strategies, leading to improved customer engagement and increased sales.
Predictive Maintenance in Manufacturing
Predictive maintenance is a critical application of data science in industries such as manufacturing. Using R, engineers can analyze sensor data from machines to predict when maintenance is required. By identifying potential equipment failures in advance, companies can minimize downtime, reduce maintenance costs, and enhance overall operational efficiency.
Healthcare Analytics for Improved Patient Outcomes
R plays a vital role in healthcare analytics, contributing to enhanced patient outcomes. Case studies in this domain showcase how data science can be utilized to analyze patient data, identify disease trends, and even predict potential outbreaks. These insights enable healthcare professionals to make informed decisions and allocate resources effectively.
At the heart of data science lies computational reasoning, the ability to formulate and solve problems logically using computational tools. R provides a platform for developing this skill by enabling practitioners to process data, apply algorithms, and interpret results systematically.
Problem-Solving: A Data-Driven Approach
Data science encourages a data-driven approach to problem-solving. By collecting and analyzing relevant data, practitioners can gain valuable insights that guide the decision-making process. R’s extensive libraries and tools empower users to tackle complex problems with confidence.
Challenges and Solutions in Data Science
Dealing with Messy Data
Real-world data is rarely clean and organized. Data scientists often grapple with missing values, inconsistencies, and outliers. R offers a plethora of data preprocessing techniques to clean, transform, and impute data, ensuring that analyses are accurate and reliable.
Overcoming Model Complexity
Developing intricate models can lead to overfitting, where the model performs well on training data but fails to generalize to new data. Through cross-validation and regularization techniques available in R, data scientists can strike a balance between model complexity and generalizability.
Interpreting Complex Results
Understanding the outputs of sophisticated algorithms is a challenge. R simplifies this process by providing visualization tools that help interpret complex results, making them accessible to both technical and non-technical stakeholders.
FAQs
Q: What is R’s role in data science? A: R serves as a powerful programming language for data analysis, visualization, and modeling, making it an essential tool in data science.
Q: Can I use R for predictive analytics? A: Absolutely! R’s robust libraries allow you to build predictive models that can forecast trends and outcomes based on historical data.
Q: How does data science enhance decision-making? A: Data science provides insights derived from data analysis, enabling informed decision-making across various industries and domains.
Q: What are some common challenges in data science? A: Challenges include dealing with messy data, avoiding overfitting, and effectively communicating complex results to stakeholders.
Q: Is computational reasoning important in data science? A: Yes, computational reasoning is crucial as it involves logical problem-solving using computational tools, forming the foundation of data science practices.
Q: Can R handle real-world, large-scale datasets? A: Yes, R can handle large datasets by utilizing efficient data manipulation techniques and memory management tools.
Conclusion
Data science in R offers a powerful approach to computational reasoning and problem-solving. Through real-world case studies, we’ve explored how this discipline can revolutionize various industries, from e-commerce to healthcare. R’s versatility and robust libraries make it a go-to tool for data scientists and analysts aiming to extract meaningful insights and drive informed decisions.
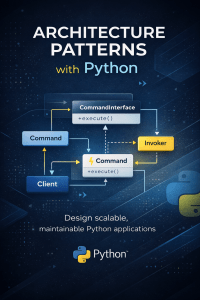
Introduction: Unveiling the Essence of Architecture Patterns with Python
In the dynamic landscape of software development, Architecture Patterns play a pivotal role in designing systems that are scalable, maintainable, and efficient. Python, a versatile and powerful programming language, seamlessly integrates with various architecture patterns to create robust software solutions. In this article, we will embark on a journey to explore the diverse range of architecture patterns that can be harnessed using Python. Whether you are a seasoned developer or an aspiring programmer, this guide will provide you with valuable insights into harnessing the potential of Python in architectural design.
1. Understanding Architecture Patterns with Python
Architecture Patterns are predefined solutions to recurring design problems. They guide the structure, organization, and communication of software components within a system. With Python’s flexibility and simplicity, developers can implement various architecture patterns to address different software design challenges.
2. The Power of Microservices Architecture
Microservices Architecture is a design paradigm where an application is composed of small, independent services that communicate with each other through APIs. Python’s lightweight nature and extensive libraries make it an ideal choice for building microservices-based applications.
3. Implementing the MVC Pattern
The Model-View-Controller (MVC) pattern is a popular architectural design used in web development. Python web frameworks like Django and Flask facilitate the implementation of MVC, enhancing code modularity and maintainability.
Event-driven architecture revolves around the production, detection, consumption, and reaction to events. Python’s event-driven libraries enable developers to create responsive and real-time applications that react to various triggers efficiently.
5. The Flexibility of Layered Architecture
Layered Architecture divides an application into logical layers, each with specific responsibilities. Python’s readability and extensive libraries make it easy to implement layered architecture, fostering clean code organization.
6. Python in Domain-Driven Design (DDD)
Domain-Driven Design focuses on aligning software projects with the domain they operate in. Python’s expressive syntax and object-oriented capabilities support the implementation of DDD principles, resulting in more cohesive and understandable codebases.
7. Exploring the Hexagonal Architecture
The Hexagonal Architecture, also known as Ports and Adapters, emphasizes separating the core application logic from external components. Python’s dependency injection capabilities and modularity align well with this pattern, promoting code reusability.
8. Event Sourcing with Python
Event Sourcing involves capturing every change in an application’s state as a sequence of events. Python’s simplicity aids in implementing event sourcing, enabling developers to track and manage changes effectively.
9. CQRS: Command Query Responsibility Segregation
CQRS decouples the command (write) and query (read) responsibilities of an application. Python’s versatile ecosystem facilitates the implementation of CQRS, ensuring efficient data manipulation and retrieval.
10. Building Data Pipelines with Python
Data pipelines are crucial for efficiently processing and transferring data between systems. Python’s libraries like Apache Airflow simplify the creation and orchestration of data pipelines, making complex data workflows manageable.
11. The Resilience of the Circuit Breaker Pattern
The Circuit Breaker Pattern prevents system failures by handling faults and failures gracefully. Python’s exception-handling mechanisms, coupled with external libraries, enable the implementation of robust circuit breakers.
12. Applying the Repository Pattern
The Repository Pattern separates data access logic from the rest of the application. Python’s object-relational mapping (ORM) frameworks, such as SQLAlchemy, aid in implementing the repository pattern effectively.
13. Python and the Gateway Pattern
The Gateway Pattern centralizes external system interactions, simplifying communication and minimizing dependencies. Python’s standard libraries and third-party packages support the creation of gateway interfaces seamlessly.
14. Scaling Horizontally with the Load Balancing Pattern
Load Balancing distributes incoming traffic across multiple instances of a service to enhance performance and availability. Python’s multi-threading and multiprocessing capabilities contribute to building efficient load-balancing solutions.
15. Dockerizing Architectures with Python
Docker containers provide isolation and portability for applications. Python’s compatibility with Docker facilitates the packaging and deployment of complex architectures, ensuring consistency across different environments.
16. Security Considerations in Architectural Design
Security is paramount in architectural design. Python’s libraries and frameworks offer robust security mechanisms, making it easier to implement authentication, encryption, and secure communication.
17. Monitoring and Logging Strategies with Python
Effective monitoring and logging are essential for maintaining system health. Python’s libraries, along with third-party tools, aid in implementing comprehensive monitoring and logging solutions.
18. Façade Pattern Simplified with Python
The Façade Pattern offers a simplified interface to a complex subsystem of an application. Python’s expressive syntax and encapsulation capabilities make it a suitable choice for creating façades that enhance code usability.
19. Python’s Role in Cloud-Native Architecture
Cloud-native architecture emphasizes scalability and resilience in cloud environments. Python’s cloud-native libraries and integrations simplify the development of applications that harness cloud capabilities.
20. GraphQL Integration with Python
GraphQL revolutionizes API design by enabling clients to request precisely the data they need. Python’s GraphQL libraries facilitate the creation of flexible and efficient APIs that cater to diverse client requirements.
21. Event-Driven Microservices with Python
Combining event-driven and microservices architecture enhances application responsiveness. Python’s event-driven libraries and asynchronous programming support the creation of event-driven microservices.
22. Choosing the Right Architecture for Your Project
Selecting the appropriate architecture pattern depends on various factors. Consider your project’s requirements, scalability needs, and team’s familiarity with Python to make an informed decision.
23. Common Challenges and Solutions
Architectural design comes with its share of challenges. Explore common hurdles developers face when implementing architecture patterns with Python and discover effective strategies to overcome them.
24. Future Trends in Architecture Patterns with Python
The field of architecture patterns is ever-evolving. Stay updated with emerging trends, such as serverless architecture, edge computing, and AI integration, to harness Python’s capabilities for futuristic designs.
25. Conclusion: Empowering Software Design with Python
In conclusion, Architecture Patterns with Python form the backbone of well-structured and efficient software systems. Python’s adaptability, coupled with its rich ecosystem of libraries and frameworks, positions it as a versatile tool for architects and developers alike. By embracing the diverse range of architecture patterns covered in this article, you can unlock new dimensions of software design that optimize performance, scalability, and maintainability.
FAQs
Q: How does Python contribute to architectural design? A: Python’s flexibility and extensive libraries make it an ideal choice for implementing various architecture patterns, enhancing software design.
Q: What is Microservices Architecture and its relation to Python? A: Microservices Architecture involves building applications from small, independent services. Python’s lightweight nature and libraries facilitate the creation of microservices-based systems.
Q: Can Python be used for event-driven architecture? A: Yes, Python offers event-driven libraries that enable the creation of real-time and responsive applications.
Q: How does the MVC pattern enhance web development with Python? A: Python web frameworks like Django and Flask support the MVC pattern, improving code modularity and maintainability in web applications.
Q: What is the significance of security considerations in architectural design with Python? A: Python’s libraries and frameworks provide robust security mechanisms, ensuring the implementation of secure authentication, encryption, and communication.
Q: How can developers choose the right architecture pattern for their projects? A: Developers should consider project requirements, scalability needs, and team expertise to select the architecture pattern that aligns with their goals.
Advanced R, the next frontier in data analysis, offers a plethora of tools and techniques to extract valuable insights from complex datasets. In this comprehensive guide, we’ll explore the capabilities and advantages of Advanced R in data analysis and visualization. From uncovering hidden patterns to creating stunning visual representations, Advanced R empowers you to navigate through the world of data with precision and confidence.
Introduction: Embracing the Power of Advanced R
In the realm of data analysis, Advanced R stands as a formidable ally, equipped with an array of features designed to transform raw data into meaningful narratives. From statisticians to researchers, business analysts to programmers, Advanced R caters to a diverse range of users seeking to unlock the potential hidden within their datasets.
1. Getting Started with Advanced R
Navigating the complexities of Advanced R might seem daunting, but the journey begins with the first step. This section will guide you through setting up Advanced R, understanding its environment, and familiarizing yourself with its syntax.
2. Data Import and Manipulation with Advanced R
Harness the power of Advanced R to import and manipulate data seamlessly. Learn how to read data from various sources, clean and preprocess it, and ensure that your data is primed for analysis.
3. Exploratory Data Analysis (EDA) using Advanced R
EDA is a crucial phase in any data analysis process. Dive into this section to discover how Advanced R enables you to unveil patterns, detect outliers, and gain insights through summary statistics and visualizations.
4. Statistical Analysis with Advanced R
Advanced R offers an arsenal of statistical tools at your fingertips. From hypothesis testing to regression analysis, this section delves into performing a wide range of statistical analyses with ease.
5. Data Visualization with Advanced R
The saying “a picture is worth a thousand words” holds true in data analysis. Explore Advanced R’s visualization capabilities and learn how to create compelling graphs, charts, and plots that convey your findings effectively.
6. Machine Learning using Advanced R
Take your analysis to the next level by diving into machine learning techniques with Advanced R. Uncover patterns, make predictions, and automate decision-making processes.
7. Advanced R for Big Data Analysis
Dealing with large datasets? Advanced R has you covered. Discover strategies and packages that allow you to efficiently analyze big data without compromising on performance.
8. Collaboration and Sharing Insights
Effective communication of insights is essential. Learn how to share your analyses, visualizations, and reports using Advanced R, fostering collaboration and informed decision-making.
9. Optimizing Performance in Advanced R
As your analyses become more intricate, optimizing performance becomes crucial. This section provides tips and techniques to enhance the efficiency of your Advanced R code.
10. Integration with Other Technologies
Explore how Advanced R can seamlessly integrate with other technologies and tools, enhancing its capabilities and allowing you to leverage its power within a broader ecosystem.
FAQs
Q: What makes Advanced R different from traditional R programming? A: Advanced R goes beyond basic programming and explores advanced techniques for data analysis, visualization, and machine learning, catering to more complex and specialized tasks.
Q: Can I use Advanced R for real-time data analysis? A: Absolutely! Advanced R provides libraries and functionalities that enable real-time data processing and analysis, making it a versatile choice for dynamic scenarios.
Q: Are there any prerequisites to learning Advanced R? A: While prior knowledge of R programming is beneficial, beginners can also dive into Advanced R by following step-by-step tutorials and gradually building their expertise.
Q: What industries benefit the most from Advanced R? A: Virtually any industry dealing with data can benefit from Advanced R. It’s extensively used in finance, healthcare, marketing, and research, among others.
Q: How does Advanced R contribute to decision-making? A: By offering robust statistical analyses and visualizations, Advanced R equips decision-makers with actionable insights, facilitating informed choices.
Q: Is Advanced R suitable for both small and big data? A: Yes, Advanced R is designed to handle datasets of varying sizes. For big data, specialized techniques and packages ensure efficient analysis without compromising speed.
Conclusion: Empower Your Data Journey with Advanced R
In the era of data-driven decision-making, Advanced R emerges as a valuable tool for professionals across domains. With its diverse capabilities spanning data analysis, visualization, and machine learning, this dynamic programming language equips you to extract insights and make informed choices. Whether you’re an aspiring data scientist or an experienced analyst, Advanced R’s comprehensive features will undoubtedly elevate your data exploration endeavors.
Python has emerged as a versatile and powerful programming language, gaining immense popularity across various domains, especially among engineers and scientists. In this comprehensive guide, we’ll delve into the realm of Python programming tailored specifically for professionals in the engineering and scientific disciplines. From its introduction and applications to key concepts and frequently asked questions, this article will equip you with insights to harness the potential of Python in your field.
Introduction to Python for Engineers and Scientists
Python, often referred to as a “high-level, general-purpose programming language,” has been embraced by engineers and scientists due to its simplicity, readability, and extensive libraries. Its user-friendly syntax makes it an excellent choice for those who are new to programming, while its capabilities extend to complex data analysis, simulations, and automation tasks.
In the realm of engineering and science, Python serves as a versatile tool for various tasks, such as data analysis, mathematical modeling, simulation, and algorithm development. Its broad range of libraries, including NumPy, SciPy, and Matplotlib, empowers professionals to analyze and visualize data effectively.
Introduction to Python for Engineers and Scientists
Python finds applications in diverse fields within engineering and science. From mechanical and civil engineering to physics and biology, professionals harness Python’s capabilities for tasks such as:
Data Analysis: Python’s libraries facilitate data manipulation, exploration, and visualization, aiding engineers and scientists in deriving insights from complex datasets.
Numerical Computing: With libraries like NumPy and SciPy, Python has become a powerful platform for mathematical computations, linear algebra, and optimization.
Simulations: Engineers use Python to simulate real-world scenarios, helping them predict outcomes and evaluate the behavior of systems.
Machine Learning and AI: Python’s extensive machine learning libraries, like TensorFlow and scikit-learn, make it a preferred language for developing predictive models and AI applications.
Control Systems: Python’s libraries enable engineers to design and analyze control systems, making it a valuable tool in fields like robotics and automation.
Signal Processing: Python’s signal processing libraries are vital for tasks such as filtering, noise reduction, and feature extraction.
Essential Concepts in Python Programming
Variables and Data Types
In Python, variables serve as placeholders for data. They dynamically adapt to the data type assigned, which can include integers, floating-point numbers, strings, and more. This flexibility simplifies coding for engineers and scientists, allowing them to focus on solving problems.
Conditional Statements and Loops
Conditional statements (if, elif, else) and loops (for, while) form the backbone of any programming language. Engineers and scientists leverage these constructs to create decision-making processes and iterate through data or processes.
Functions and Modules
Python’s modular approach enables professionals to break down complex tasks into smaller, manageable functions. These functions can be bundled into modules, promoting reusability and organization within codebases.
Libraries and Packages
The Python ecosystem thrives on its rich collection of libraries and packages. Engineers and scientists can import pre-written functions and classes to expedite tasks, eliminating the need to reinvent the wheel.
Handling Exceptions
Exception handling ensures that programs gracefully handle errors. Engineers and scientists utilize try-except blocks to anticipate potential errors and prevent program crashes.
FAQs About Python for Engineers and Scientists
How can Python benefit engineers and scientists in their work?
Python offers a simplified syntax and extensive libraries that streamline tasks such as data analysis, simulations, and modeling. Its adaptability makes it accessible to newcomers while catering to complex requirements.
Is Python suitable for scientific computing?
Absolutely. Python’s scientific libraries like NumPy and SciPy empower scientists to perform complex mathematical computations, simulations, and data analysis efficiently.
What advantages do Python libraries provide in engineering projects?
Python libraries offer pre-built functions and tools that expedite development. This accelerates the creation of solutions, from numerical computations to control systems design.
Can Python handle large datasets common in scientific research?
Yes, Python’s libraries, such as Pandas, efficiently manage and manipulate large datasets, enabling scientists to extract meaningful insights from extensive research data.
How does Python contribute to machine learning in engineering?
Python’s machine learning libraries, including TensorFlow and scikit-learn, empower engineers to create predictive models and implement AI solutions, enhancing engineering processes.
Is Python’s simplicity a limitation for complex engineering tasks?
No, Python’s simplicity is its strength. It allows engineers and scientists to focus on problem-solving rather than struggling with convoluted syntax, promoting efficient coding practices.
Conclusion
Python’s widespread adoption among engineers and scientists is a testament to its versatility and effectiveness. Its applications span from data analysis to simulations, offering solutions for challenges across various domains. By embracing Python, professionals can unlock new levels of efficiency and innovation in their respective fields.
Python is a versatile programming language known for its simplicity and readability. Whether you’re a beginner or an experienced developer, mastering Python tricks can significantly enhance your coding efficiency. In this article, we’ll delve into powerful tips that cover various aspects of Python programming. These tips will not only make your code more elegant but also improve your problem-solving skills. Let’s dive into the world of Python tricks and take your coding expertise to the next level.
Introduction: Unleashing the Potential of Python Tricks
Python is celebrated for its user-friendly syntax and extensive libraries, but what truly sets it apart are the clever tricks and techniques that developers use to make their code cleaner, more efficient, and sometimes even downright ingenious. Whether you’re optimizing loops, handling data structures, or automating tasks, Python has an arsenal of tricks that can save you time and elevate your code to new heights.
When it comes to looping, Python offers an elegant solution: list comprehensions. Instead of writing verbose for-loops, you can use a concise one-liner that creates a new list based on an existing iterable. This not only saves space but also enhances readability.
Context Managers for Resource Management
Resource management is crucial in programming. Python’s with statement allows you to create a context manager that automatically takes care of setup and teardown operations. For example, the open() function for file handling is better used as a context manager to ensure proper file closure.
Leveraging Dictionaries for Switch-Case Logic
Python lacks a traditional switch-case statement, but you can simulate this behavior using dictionaries. Map case values to functions or outcomes, providing a clean and efficient alternative.
Python Tricks: Handling Multiple Return Values
Functions often return multiple values, and Python makes it convenient to unpack them using tuple unpacking. This enhances code clarity and eliminates the need for complex data structures.
Efficient String Formatting with F-Strings
F-strings, introduced in Python 3.6, provide a concise and efficient way to format strings. Incorporate variables directly into string literals, making your code more readable and maintainable.
Embrace Generators for Large Datasets
When dealing with large datasets, generators offer a memory-efficient solution. Unlike lists, generators produce data on the fly, saving memory and improving performance.
Decorators for Code Modularity
Decorators allow you to modify the behavior of functions or methods without changing their source code. This promotes modularity and reusability in your codebase.
List Slicing for Subsequences
Python’s list slicing enables you to extract subsequences from lists effortlessly. This concise syntax is not only readable but also prevents off-by-one errors.
Leverage Python Libraries
Python boasts a myriad of libraries for various purposes. Whether it’s NumPy for scientific computing, pandas for data manipulation, or matplotlib for data visualization, incorporating these libraries can significantly expedite your coding tasks.
Exploit the Power of Enumerate
Enumerate is a handy function for iterating over an iterable while keeping track of the index. This eliminates the need for manual index management and enhances code readability.
Handling Exceptions Gracefully
Python’s try and except blocks allow you to handle exceptions gracefully, preventing program crashes. This is particularly useful when dealing with external resources or user input.
FAQs
How can I become proficient in using these Python tricks?
Becoming proficient in Python tricks requires practice and exposure to real-world coding scenarios. Start by implementing these tricks in your projects and gradually explore more advanced techniques.
Are these Python tricks suitable for beginners?
Yes, many of these tricks are suitable for beginners. They can help beginners write more concise and efficient code from the outset, fostering good coding practices.
Can I use these tricks in any Python version?
Most of these tricks are applicable to Python 3.x versions. However, make sure to check the documentation for any version-specific differences.
Do these tricks replace the need for learning Python fundamentals?
No, Python tricks are meant to complement your understanding of Python fundamentals. They provide alternative and efficient ways to approach coding challenges, but a strong grasp of fundamentals is essential.
What’s the best way to learn about Python’s built-in functions and libraries?
The official Python documentation is an excellent resource to learn about built-in functions and libraries. Additionally, online tutorials and coding communities can provide practical insights and examples.
How can I contribute my own Python tricks to the community?
If you’ve discovered innovative Python tricks, consider sharing them on coding forums, social media, or personal blogs. Open-source platforms like GitHub are also great for contributing to the community.
Conclusion: Elevate Your Python Coding Game
Python tricks are the secret sauce that can transform your coding from mundane to magnificent. By incorporating these tricks into your programming repertoire, you’ll not only write more efficient and readable code but also develop a deeper understanding of Python’s capabilities. So, embrace these tricks, experiment with them in your projects, and unlock the full potential of Python programming.
Statistics With R: Solving Problems Using Real-World Data: In an era driven by data, harnessing the power of statistics is key to deriving meaningful insights from the vast sea of information around us. The fusion of statistical analysis with the programming prowess of R opens up a world of opportunities to solve real-world problems efficiently and effectively. In this comprehensive guide, we’ll delve into the realm of Statistics With R and explore how this dynamic duo can unravel complex problems using real-world data.
Statistics With R Solving Problems Using Real-World Data
Imagine having the ability to extract actionable insights from a dataset, uncover hidden patterns, and make informed decisions – that’s the promise Statistics With R brings to the table. By marrying the statistical prowess of this powerful programming language, we can dive into data, explore its depths, and emerge with answers to complex questions that drive industries, businesses, and research forward.
Statistics With R: Solving Problems Using Real-World Data
At its core, Statistics With R involves using R programming to conduct statistical analyses. Whether it’s data visualization, hypothesis testing, regression analysis, or machine learning, R provides a versatile toolkit to tackle a wide range of problems. This versatility, coupled with its open-source nature, has made R a favorite among statisticians, analysts, and researchers.
Navigating Real-World Data Challenges
Real-world data is often messy, unstructured, and abundant. Here’s where the true power of Statistics With R shines. It equips us with tools to clean, preprocess, and transform data into a usable format. Whether you’re handling missing values, and outliers, or dealing with skewed distributions, R offers a plethora of packages and functions to streamline the process.
Data Visualization: Unveiling Insights
They say a picture is worth a thousand words, and in the world of statistics, it’s certainly true. R boasts a rich ecosystem of visualization libraries, such as ggplot2, that allows us to create stunning visuals that tell compelling stories. Whether it’s histograms, scatter plots, or interactive visualizations, R empowers us to convey complex information in an understandable manner.
Hypothesis Testing and Beyond
Statistics isn’t just about describing data – it’s about making inferences and decisions based on that data. R comes equipped with a wide array of statistical tests, enabling us to validate hypotheses, compare groups, and make predictions. This is invaluable across domains, from healthcare to finance, where evidence-based decisions reign supreme.
Regression Analysis: Predictive Insights
Regression analysis lies at the heart of predictive modeling. Whether linear, logistic, or polynomial regression, R provides the tools to build models that predict outcomes based on input variables. This has applications ranging from sales forecasting to clinical outcome predictions, empowering businesses and researchers to plan ahead.
Machine Learning with R
The advent of machine learning has revolutionized how we approach problem-solving. R doesn’t lag in this arena either. With libraries like caret and randomForest, we can explore classification, clustering, and ensemble methods. This not only enriches our analytical toolkit but also equips us to tackle complex problems with cutting-edge solutions.
Challenges and Learning Curve
Adopting Statistics With R comes with a learning curve, as with any new skill. Navigating through R’s syntax, understanding various packages, and optimizing code for performance can be daunting initially. However, the vast community, online resources, and tutorials ensure that the journey from novice to proficient analyst is well-guided.
FAQs About Statistics With R Solving Problems Using Real-World Data
Q: How can I start learning Statistics With R? A: You can begin by exploring online tutorials, interactive courses, and books dedicated to learning R programming and statistics.
Q: Is R suitable for big data analysis? A: While R is powerful for various analyses, big data scenarios might require additional tools like Spark or Hadoop for optimal processing.
Q: Can R handle data from different sources? A: Absolutely. R supports data import from diverse sources, including spreadsheets, databases, web scraping, and APIs.
Q: What are some real-world applications of Statistics With R? A: R has been employed in diverse fields such as healthcare (patient outcome prediction), finance (risk assessment), and social sciences (survey analysis).
Q: Are there alternatives to R for statistical analysis? A: Yes, alternatives include Python (with libraries like pandas and scikit-learn) and software like SAS and SPSS.
Q: How can I optimize the performance of R code? A: Profiling, vectorization, and efficient package usage are some strategies to enhance the performance of your R code.
Conclusion
Statistics With R is a powerful toolset that bridges the gap between raw data and actionable insights. Its ability to handle real-world data, coupled with its analytical capabilities, makes it an indispensable asset for professionals in various domains. From exploratory data analysis to complex machine learning tasks, R empowers us to solve problems, make informed decisions, and contribute to the advancement of knowledge across industries.
A Beginner’s Guide to Data Visualisation Statistical Analysis and Programming in R: Welcome to the world of data visualization statistical analysis and programming in R Whether you’re a complete novice or have some programming experience, this guide will walk you through the fundamentals of R programming and its applications in data analysis. In this article, we’ll cover everything you need to know to get started with R, from its basic syntax to creating stunning visualizations and performing statistical analyses. So, let’s embark on this learning journey and unlock the potential of R programming together.
1. Understanding R: Introduction to Data Science
R is a powerful and versatile programming language designed for data analysis and visualization. It’s widely used by statisticians, data scientists, and researchers to analyze, visualize, and interpret complex datasets. With its rich ecosystem of packages and libraries, R offers a wide range of tools to manipulate data, perform statistical tests, and generate meaningful insights.
A Beginner’s Guide to Data Visualisation, Statistical Analysis and Programming in R
Before diving into R programming, you’ll need to set up your environment. Download and install R from the official website, and consider using RStudio, a popular integrated development environment (IDE) for R. RStudio provides a user-friendly interface that simplifies coding, debugging, and visualization.
3. Basic R Syntax and Data Structures
In this section, we’ll explore the basic syntax of R and its fundamental data structures. Learn how to create variables, assign values, and manipulate data using vectors, matrices, and lists. Understanding these foundational concepts is crucial for effectively working with data in R.
4. Data Input and Output
To analyze data, you first need to import it into R. Discover various methods to read data from different file formats, such as CSV, Excel, and text files. Likewise, learn how to export your results to these formats, ensuring seamless data exchange between R and other applications.
5. Data Cleaning and Preprocessing
Data analysis often starts with data cleaning and preprocessing. Explore techniques to handle missing values, remove duplicates, and transform data into a suitable format. A clean dataset is essential for accurate analysis and visualization.
6. Statistical Analysis with R
R provides an extensive toolkit for statistical analysis. Learn how to perform descriptive statistics, hypothesis testing, regression analysis, and more. Gain insights into your data by applying various statistical techniques and interpreting the results.
7. Data Visualization with ggplot2
Visualizing data is a powerful way to communicate insights. Dive into ggplot2, a popular R package for creating captivating visualizations. Master the art of generating bar plots, scatter plots, histograms, and more, enhancing your ability to present data effectively.
8. Advanced Data Visualization Techniques
Take your data visualization skills to the next level with advanced techniques. Learn how to create interactive visualizations, heatmaps, and geospatial plots. These techniques add depth and interactivity to your data presentations.
9. Introduction to Programming Concepts
R is not only about data analysis; it’s also a full-fledged programming language. Explore programming concepts such as loops, conditional statements, and functions. Understanding these concepts will enable you to write efficient and modular R code.
10. Working with R Packages
R’s strength lies in its packages. These are collections of functions and data sets that extend R’s capabilities. Discover how to install, load, and use packages to access specialized tools for specific tasks, from time series analysis to machine learning.
11. Data Manipulation and Transformation
Data manipulation is a crucial skill in data analysis. Learn how to reshape, aggregate, and transform data using packages like dplyr and tidyr. These tools simplify complex data operations and allow you to focus on insights rather than data wrangling.
12. Introduction to Machine Learning in R
R offers numerous packages for machine learning and predictive modeling. Get a glimpse into the world of machine learning by exploring concepts like supervised and unsupervised learning. Build your first machine learning model and evaluate its performance.
13. Time Series Analysis with R
Time series data is prevalent in various fields, from finance to environmental studies. Learn how to handle and analyze time series data using specialized R packages. Uncover patterns, trends, and seasonal variations within temporal datasets.
14. Statistical Inference and Hypothesis Testing
Delve deeper into statistical inference by mastering hypothesis testing techniques. Understand concepts like p-values, confidence intervals, and t-tests. Apply these techniques to draw meaningful conclusions from your data.
15. Collaboration and Sharing in R
Collaboration is essential in data science projects. Discover how to share your R code, visualizations, and analyses with others. Explore version control systems like Git and platforms like GitHub for efficient teamwork.
16. Creating Interactive Dashboards
Interactive dashboards allow users to explore data on their terms. Learn how to create interactive dashboards using R Shiny. Design customized interfaces that enable users to interactively visualize data and gain insights.
17. Best Practices and Tips for R Programming
Efficient coding practices can save time and reduce errors. Explore coding best practices, debugging techniques, and optimization tips. Write clean, modular, and maintainable code that enhances your productivity.
18. Resources for Further Learning
As your journey with R continues, you’ll find a plethora of resources to deepen your knowledge. Explore online courses, books, forums, and communities dedicated to R programming. Continuously enhance your skills to become an R expert.
FAQs
Can I learn R programming without any prior coding experience? Absolutely! R is a great language for beginners due to its intuitive syntax and extensive documentation. With dedication and practice, you can grasp the fundamentals even if you’re new to coding.
What are some real-world applications of R programming? R is widely used in industries like finance, healthcare, marketing, and academia for tasks such as financial analysis, data visualization, predictive modeling, and research.
Do I need to be a mathematician to use R for statistical analysis? While a basic understanding of statistics is helpful, R’s packages often handle complex calculations. You can gradually enhance your statistical knowledge as you work with R.
Is R better than other programming languages for data analysis? Each language has its strengths, but R’s extensive statistical libraries and visualization capabilities make it a preferred choice for data analysis and visualization tasks.
How can I showcase my R projects to potential employers or collaborators? Platforms like GitHub allow you to share your code and projects with others. Creating a portfolio of your work demonstrates your skills and dedication to potential employers or collaborators.
Are there online communities for R programmers to seek help and connect with others? Yes, platforms like Stack Overflow and RStudio Community are excellent places to ask questions, seek guidance, and connect with fellow R enthusiasts.
Conclusion
Congratulations on completing this comprehensive beginner’s guide to data visualization, statistical analysis, and programming in R. You’ve taken the first step toward becoming proficient in R programming and harnessing its power for insightful data analysis. Remember that mastery takes time, practice, and a curious mindset. Continuously explore new techniques, collaborate with peers, and tackle real-world projects to refine your skills.
Machine Learning with Python Tutorial: In the era of big data, the ability to extract valuable insights from vast amounts of information has become invaluable. Machine learning, a subset of artificial intelligence, empowers computers to learn patterns from data and make predictions or decisions without explicit programming. Python, renowned for its simplicity and extensive libraries, offers an ideal platform for implementing machine learning algorithms. Whether you’re a seasoned programmer or a newcomer to coding, our Machine Learning with Python Tutorial will guide you through the intricacies of this dynamic field.
What is Machine Learning?
Machine learning is a subset of artificial intelligence that focuses on the development of algorithms and models that enable computers to learn from data. Instead of being explicitly programmed, these algorithms learn patterns and make data-driven decisions. Machine learning encompasses various techniques, including supervised learning, unsupervised learning, and reinforcement learning, each serving different purposes in solving complex problems.
Machine Learning with Python Tutorial: Types of Machine Learning
Machine learning techniques can be broadly categorized into three types: supervised learning, unsupervised learning, and reinforcement learning. In supervised learning, algorithms learn from labeled training data to make predictions or decisions. Unsupervised learning involves exploring data without predefined labels, aiming to discover hidden patterns or structures. Reinforcement learning is inspired by behavioral psychology, where algorithms learn to take actions in an environment to maximize rewards.
Benefits of Machine Learning
Machine learning offers a plethora of benefits across industries. It enables businesses to make informed decisions based on data-driven insights, leading to enhanced efficiency and accuracy. In healthcare, machine learning aids in disease diagnosis and treatment planning. In finance, it drives fraud detection and stock market prediction. By automating routine tasks and enabling predictive analysis, machine learning has the potential to reshape the future of work.
Getting Started with Python
Python’s simplicity and versatility make it an excellent choice for implementing machine learning algorithms. To begin, you need to install Python on your system. Visit the official Python website to download the latest version and follow the installation instructions for your operating system. Once Python is installed, you can start using it for various programming tasks, including machine learning.
Essential Python Libraries for Machine Learning
Python’s strength lies in its libraries, and several are essential for machine learning. Some of the most popular libraries include:
NumPy: A foundational package for numerical computations, essential for operations involving arrays and matrices.
Pandas: A data manipulation and analysis library that provides powerful data structures for efficient data handling.
Scikit-learn: A user-friendly machine learning library that features various classification, regression, and clustering algorithms.
Matplotlib and Seaborn: Libraries for data visualization, enabling you to create informative plots and graphs.
TensorFlow and Keras: Libraries for creating and training neural networks and deep learning models.
Supervised vs. Unsupervised Learning
In supervised learning, algorithms learn from labeled data, where each input is associated with a corresponding output. The algorithm learns to map inputs to outputs based on the training data. On the other hand, unsupervised learning involves working with unlabeled data. The goal is to discover patterns or groupings within the data, making it ideal for tasks like clustering and dimensionality reduction.
Key Terminologies in Machine Learning
As you dive into machine learning, you’ll encounter several key terminologies:
Features: These are the input variables that the algorithm uses to make predictions.
Labels: In supervised learning, labels are the correct outputs associated with the training data.
Training Data: The data used to train the machine learning algorithm.
Testing Data: Separate data used to evaluate the performance of the trained model.
Model: The algorithm or mathematical representation that the machine learns from the training data.
Data Preprocessing and Cleaning
Before feeding data into a machine learning algorithm, it’s crucial to preprocess and clean it. This involves handling missing values, scaling features, and encoding categorical variables. Data preprocessing ensures that the algorithm receives clean and structured data, which leads to more accurate and reliable predictions.
Setting Up Your Development Environment
To start building machine learning models with Python, you’ll need a development environment. One popular option is Jupyter Notebook, which provides an interactive platform for writing and executing code. Alternatively, you can use integrated development environments (IDEs) like PyCharm or Visual Studio Code for a comprehensive coding experience.
Building Your First Machine Learning Model
Let’s take a hands-on approach and build a simple machine learning model using Python. We’ll use the famous Iris dataset, which contains features of different iris flowers along with their species labels. Our goal is to train a model that can predict the species of an iris flower based on its features.
import pandas as pd
from sklearn.model_selection import train_test_split
from sklearn.tree import DecisionTreeClassifier
from sklearn.metrics import accuracy_score

# Load the Iris dataset
iris_data = pd.read_csv('iris.csv')

# Split the data into features (X) and labels (y)
X = iris_data.drop('species', axis=1)
y = iris_data['species']

# Split data into training and testing sets
X_train, X_test, y_train, y_test = train_test_split(X, y, test_size=0.2, random_state=42)

# Initialize the Decision Tree classifier
clf = DecisionTreeClassifier()

# Train the model on the training data
clf.fit(X_train, y_train)

# Make predictions on the testing data
predictions = clf.predict(X_test)

# Calculate the accuracy of the model
accuracy = accuracy_score(y_test, predictions)
print(f'Accuracy: {accuracy:.2f}')
Evaluating Model Performance
Evaluating the performance of a machine learning model is crucial to understanding its effectiveness. Common evaluation metrics include accuracy, precision, recall, and F1-score. In our example, the accuracy score tells us how well our model predicts the iris flower species. However, it’s important to note that the choice of evaluation metric depends on the nature of the problem.
Decision Trees and Random Forests
Decision trees are a fundamental concept in machine learning. These are tree-like structures that aid in decision-making by mapping features to outcomes. Random Forests, an ensemble technique, combine multiple decision trees to improve prediction accuracy and reduce overfitting. This technique is widely used in various fields, including medicine and finance, for tasks like disease prediction and credit scoring.
Support Vector Machines (SVM)
Support Vector Machines are powerful algorithms used for classification and regression tasks. SVM aims to find a hyperplane that best separates different classes in the feature space. This hyperplane maximizes the margin between classes, leading to better generalization on unseen data. SVMs have applications in image classification, text categorization, and more.
Neural Networks and Deep Learning
Neural networks are inspired by the human brain’s structure and function. These interconnected layers of nodes (neurons) process and transform data, enabling machines to learn complex patterns. Deep learning involves training deep neural networks with multiple hidden layers. This technique has led to breakthroughs in image and speech recognition, natural language processing, and autonomous vehicles.
Clustering Techniques
Clustering algorithms group similar data points together based on their features. K-Means clustering is a popular technique that partitions data into clusters, where each data point belongs to the cluster with the nearest mean. Clustering finds applications in customer segmentation, anomaly detection, and recommendation systems.
Image and Speech Recognition
Machine learning and Python play a pivotal role in image and speech recognition. Image recognition algorithms can identify objects, scenes, and even faces within images. Speech recognition technology powers virtual assistants like Siri and Google Assistant, converting spoken language into text and enabling seamless human-computer interaction.
Natural Language Processing (NLP)
Natural Language Processing focuses on enabling machines to understand, interpret, and generate human language. Python libraries like NLTK and spaCy provide tools for text preprocessing, sentiment analysis, and language generation. NLP is used in chatbots, language translation, and content summarization.
Recommender Systems
Recommender systems, often used by platforms like Netflix and Amazon, suggest products or content to users based on their preferences and behaviors. Collaborative filtering and content-based filtering are two common approaches. Python’s machine learning libraries make it feasible to build personalized recommender systems.
Anomaly Detection
Anomaly detection involves identifying unusual patterns or outliers in data. This technique finds applications in fraud detection, network security, and manufacturing quality control. By training models on normal data, machine learning algorithms can detect anomalies that deviate from the learned patterns.
High-Quality Learning Platforms
Accelerate your learning journey with online platforms like Coursera, edX, and Udacity. These platforms offer courses on machine learning, often taught by industry experts and academics. You can also earn certificates to showcase your skills to potential employers.
Open Source Machine Learning Projects
Engage with the machine learning community by contributing to open-source projects. Platforms like GitHub host a plethora of repositories dedicated to machine learning and data science. By collaborating on these projects, you’ll enhance your coding skills and gain valuable experience.
Community Forums and Support
Stay connected with fellow learners and professionals through community forums like Stack Overflow and Reddit. These platforms are a treasure trove of information, where you can ask questions, share insights, and learn from others’ experiences. Don’t hesitate to seek help when faced with challenges.
Bias and Fairness in Machine Learning
As we harness the power of machine learning, it’s crucial to address biases that can inadvertently find their way into algorithms. Biased training data can lead to discriminatory outcomes, impacting decisions and perpetuating inequalities. As a responsible practitioner, strive to develop models that are fair, transparent, and unbiased.
Privacy and Data Security
Machine learning relies heavily on data, which can contain sensitive information. Ensuring data privacy and security is paramount. When handling user data, adhere to best practices for data anonymization and encryption. Consider the ethical implications of data collection and usage.
Transparency and Accountability
Transparency in machine learning involves understanding how algorithms make decisions. As models become more complex, their decision-making processes can become opaque. Strive to develop interpretable models that provide explanations for their predictions. Additionally, be accountable for the consequences of your models’ decisions.
Machine Learning with Python Tutorial: FAQs and Troubleshooting
Q: How do I choose the right algorithm for my task?
A: The choice of algorithm depends on factors like the nature of your data, the problem you’re solving, and your desired outcome. Experiment with different algorithms and evaluate their performance to find the best fit.
Q: What are some common challenges in machine learning?
A: Challenges include overfitting (model memorizes training data), underfitting (model doesn’t capture data patterns), and bias in training data. Regularization techniques, more data, and diverse datasets can mitigate these challenges.
Q: How can I prevent overfitting in my models?
A: Techniques like cross-validation, early stopping, and regularization can help prevent overfitting. Cross-validation assesses model performance on different data subsets, while regularization adds constraints to the model to prevent excessive complexity.
Q: What resources can help me stay updated in this field?
A: Follow reputable blogs, podcasts, and social media accounts related to machine learning. Platforms like Kaggle host competitions that expose you to real-world challenges and solutions.
Q: Why is Python a preferred language for ML?
A: Python’s simplicity, readability, and extensive libraries make it an ideal choice for machine learning. Libraries like NumPy, Pandas, and Scikit-learn provide tools for data manipulation, analysis, and modeling.
Q: What are some real-world applications of ML and Python?
A: ML and Python power autonomous vehicles, medical diagnoses, financial predictions, recommendation systems, fraud detection, and much more.
Conclusion
Congratulations! You’ve embarked on an exciting journey into the realm of machine learning with Python. This tutorial has equipped you with the foundational knowledge to explore diverse machine learning techniques, create predictive models, and solve real-world problems. As you continue your learning, remember that the field of machine learning is dynamic and ever-evolving. Stay curious, collaborate with fellow enthusiasts, and contribute to the advancement of this transformative technology.
Python for Everybody: Exploring Data Using Python 3: Python has emerged as a powerhouse in the world of programming, revolutionizing data exploration and analysis. Whether you are a beginner or an experienced programmer, Python offers an intuitive and versatile platform for data manipulation, exploration, and visualization. In this guide, we’ll delve into the world of Python for Everybody, where we’ll explore how Python 3 can be harnessed to uncover meaningful insights from data. From fundamental concepts to advanced techniques, this article is your go-to resource for mastering data analysis using Python.
Python for Everybody: Exploring Data Using Python 3: Getting Started
Python for Everybody: Exploring Data Using Python 3 is designed to equip you with the foundational knowledge needed to navigate the vast landscape of data analysis. Let’s kick off our journey by understanding the key components and tools you’ll be working with:
Python for Everybody: Exploring Data Using Python 3
At the heart of Python’s popularity lies its simplicity and readability. Python’s syntax resembles human language, making it an ideal choice for beginners. Variables, data types, and basic operations are the building blocks you’ll grasp in no time.
Libraries: Your Arsenal for Data Manipulation
Python’s strength lies in its libraries. Libraries such as NumPy, pandas, and Matplotlib empower you to efficiently manipulate, analyze, and visualize data. NumPy provides support for mathematical operations on large, multi-dimensional arrays, while pandas offers data structures for efficient data manipulation and analysis.
Data Acquisition: Gathering the Raw Material
Before diving into analysis, you need data. Learn how to fetch data from various sources—CSV files, databases, APIs—and ensure its cleanliness and integrity.
Data Cleaning and Preprocessing: Refining the Raw Material
Raw data often comes with imperfections. Discover techniques to clean and preprocess data, including handling missing values, outliers, and inconsistencies.
Exploring Data: Unveiling Insights with Python 3
With a solid foundation, you’re ready to embark on the journey of exploring data and uncovering hidden patterns. Let’s dive into the exciting aspects of data exploration:
Descriptive Statistics: Summarizing Data
Descriptive statistics provide a snapshot of your data’s main characteristics. Learn how to calculate measures like mean, median, and standard deviation, and gain insights into your dataset’s distribution.
Data Visualization: Painting a Picture of Insights
Visualizations are your storytellers. Matplotlib and Seaborn empower you to create stunning visual representations of your data, making complex patterns easy to understand.
Exploratory Data Analysis (EDA): Understanding Relationships
EDA involves probing deeper into your data to identify relationships, correlations, and trends. With Python 3, you can perform EDA efficiently using libraries like pandas and Seaborn.
Hypothesis Testing: Drawing Inferences
Python provides tools to test hypotheses and draw statistical inferences from your data. Explore t-tests, ANOVA, and chi-square tests to make informed decisions.
Advanced Techniques: Going Beyond the Basics
As you gain confidence, you’ll want to explore advanced techniques that elevate your data analysis prowess:
Machine Learning: Predictive Insights
Machine learning allows you to build models that predict future outcomes based on historical data. Scikit-Learn is a powerful library that opens the doors to machine learning algorithms.
Time Series Analysis: Unraveling Temporal Data
Time series data is prevalent in various fields. Learn how to analyze and forecast time-dependent trends using Python’s libraries.
Text Analysis: Extracting Meaning from Text
Language is data too. Natural Language Processing (NLP) techniques enable you to analyze text sentiment, perform topic modeling, and extract valuable information from textual data.
FAQs
How long does it take to learn Python for data analysis?
Learning Python for data analysis depends on your prior programming experience. If you’re new to programming, it might take a few months to grasp the fundamentals. With consistent practice, you can become proficient in around 6 to 12 months.
Is Python suitable for big data analysis?
Yes, Python can handle big data analysis. Libraries like Dask and PySpark enable parallel and distributed computing, making it feasible to analyze massive datasets.
Can I perform data visualization in Python?
Absolutely. Python offers libraries like Matplotlib, Seaborn, and Plotly for creating diverse and insightful visualizations.
What are the career prospects for Python data analysts?
Python data analysts are in high demand across industries such as finance, healthcare, e-commerce, and more. Mastering Python for data analysis can open doors to lucrative job opportunities.
Are there any prerequisites for learning Python for data analysis?
No specific prerequisites are required, but a basic understanding of programming concepts will be helpful. Python’s user-friendly syntax makes it accessible for beginners.
How can I practice and enhance my Python skills?
Engage in hands-on projects, tackle real-world datasets, and participate in coding challenges on platforms like Kaggle. Continuous practice is key to improving your Python skills.
Conclusion
Python for Everybody: Exploring Data Using Python 3 empowers you to unravel the potential of data through the lens of Python programming. From foundational concepts to advanced techniques, this guide has provided you with insights to embark on your data analysis journey confidently. Embrace the power of Python and discover the art of transforming raw data into actionable insights.
In the realm of data science, a remarkable transformation has been catalyzed by the integration of spatial data analysis. The amalgamation of traditional data analysis with spatial context has given birth to a field called Spatial Data Science. This exciting domain involves the extraction of profound insights from geographical data, adding a new layer of understanding to the information-rich world of analytics. As we embark on this journey, let’s delve into the captivating world of Spatial Data Science With Applications in R.
Spatial Data Science With Applications in R
Spatial Data Science, often referred to as Geospatial Data Science, revolves around the exploration, analysis, and interpretation of data that holds a geographical component. It encompasses a diverse range of fields, from urban planning and environmental monitoring to logistics optimization and epidemiology. The synergy of data science techniques and spatial information opens up avenues for answering complex questions that were previously elusive.
Location, location, location. This mantra holds not only in real estate but also in the realm of data. Location intelligence, a core facet of spatial data science, empowers us to unravel hidden patterns, correlations, and trends. By integrating spatial context into analysis, we can discern insights that remain concealed in traditional analyses. This strategic integration of location and data leads to more informed decision-making across industries.
Significance of Spatial Data Science
Spatial data is omnipresent, generated by devices, sensors, and platforms. This data captures the “where” dimension, offering a unique lens to understand various phenomena. Spatial Data Science adds value by transforming this raw data into actionable insights. For instance, it aids urban planners in optimizing traffic routes, assists ecologists in studying habitat changes, and aids businesses in targeted marketing based on geographic preferences.
Methodologies in Spatial Data Science
Spatial Data Science encompasses a variety of methodologies to analyze geospatial information effectively. From basic spatial queries to advanced machine learning techniques, the toolkit is expansive. R, a powerful programming language and environment for statistical computing, emerges as a pivotal tool in implementing these methodologies. Its rich ecosystem of packages dedicated to spatial analysis makes it a preferred choice for spatial data scientists.
Unveiling Applications with R
R, known for its data analysis and visualization prowess, seamlessly integrates spatial data analysis. Let’s explore some intriguing applications:
1. Geographical Information Systems (GIS)
R facilitates the creation of interactive and dynamic maps, enabling users to visualize complex spatial data. By integrating GIS functionalities, R empowers users to analyze and display data in ways that reveal spatial relationships effectively.
2. Spatial Clustering
Unsupervised machine learning techniques, available in R, allow the identification of spatial clusters. This finds applications in identifying disease hotspots, customer segmentation, and resource allocation.
3. Environmental Analysis
R aids in assessing environmental changes by analyzing satellite imagery, climate data, and topographical information. This supports informed decision-making in fields like conservation and disaster management.
4. Urban Planning
For urban planners, R assists in simulating urban growth, optimizing public transportation routes, and evaluating the impact of infrastructure projects on the urban landscape.
5. Epidemiological Studies
R’s spatial packages enable epidemiologists to track the spread of diseases, model their transmission, and devise effective containment strategies.
Frequently Asked Questions (FAQs)
How does spatial data differ from other types of data?
Spatial data includes geographic information, adding a “where” component to the data. This geographical context enables spatial data to reveal location-based patterns and relationships that other data types might miss.
What are the prerequisites for learning spatial data science with R?
To venture into spatial data science with R, a fundamental understanding of data science concepts and some familiarity with R programming is beneficial. However, many resources offer step-by-step guidance for beginners.
Can I perform real-time spatial analysis using R?
Yes, R allows real-time spatial analysis by leveraging libraries that enable the integration of real-time data streams with spatial datasets. This capability is invaluable for applications such as ride-hailing service optimization and environmental monitoring.
Are there any limitations to spatial data science?
Like any field, spatial data science has its challenges. Data quality, privacy concerns, and the computational intensity of specific analyses can pose hurdles. However, advancements in technology and methodologies continue to address these limitations effectively.
How can businesses benefit from spatial data science?
Businesses can gain a competitive edge by utilizing spatial data science. It aids in site selection, customer profiling, supply chain optimization, and understanding market trends based on geographic preferences.
Is spatial data science relevant beyond Earth?
Absolutely! Spatial data science extends beyond our planet. It’s crucial in planetary exploration, analyzing data from satellites and rovers to understand celestial bodies and their features.
Conclusion
Spatial Data Science With Applications in R represents a harmonious blend of data science prowess and geographical context. The fusion of these two realms leads to enhanced decision-making, deeper insights, and innovative solutions across domains. As technology continues to evolve, so does the landscape of spatial data science, promising an exciting future of discoveries waiting to be unlocked through the power of location intelligence.