Microsoft Excel is a widely used spreadsheet application that offers a user-friendly interface for organizing and analyzing data. On the other hand, R is a powerful programming language and environment for statistical computing and graphics. While Excel excels at data manipulation and basic analysis, R provides advanced statistical techniques and data visualization capabilities. Combining the strengths of both tools, RExcel provides a seamless interface between R and Excel, allowing users to leverage the power of R within the familiar Excel environment.
Benefits of Using R Through Excel
The integration of R and Excel offers several advantages to data analysts, statisticians, and researchers. Firstly, it allows them to utilize the flexibility and ease of use of Excel alongside the sophisticated statistical techniques and data visualization capabilities of R. This synergy enables users to perform complex analyses without the need to switch between different software tools, saving time and effort.
By using R through Excel, data analysis and visualization tasks can be streamlined. Users can import data into Excel, manipulate it using Excel’s familiar formulas and functions, and then tap into R’s extensive range of statistical functions and packages for deeper analysis. This integration facilitates a more efficient workflow and enhances productivity.
One of the key benefits is the ability to leverage R’s vast array of statistical capabilities. R provides numerous packages and functions for advanced statistical analysis, machine learning, time series analysis, and more. By accessing these capabilities within Excel, users can perform sophisticated statistical modeling, hypothesis testing, and regression analysis to derive meaningful insights from their data.
Collaboration and sharing of analyses are also simplified with RExcel. Users can create Excel workbooks containing R code, functions, and visualizations. These workbooks can be easily shared with others, who can run the R code and reproduce the analyses without the need for a deep understanding of R. This enhances collaboration among team members and facilitates the dissemination of analytical findings.

Setting Up R Through Excel
To begin using, you need to install both R and the RExcel add-in. R is a free and open-source programming language that can be downloaded and installed from the official R website. Once R is installed, you can proceed to install the RExcel add-in, which establishes the connection between R and Excel. The installation process may vary depending on your operating system, but detailed instructions can be found in the RExcel documentation.
Performing Statistical Analysis in Excel Using R
With RExcel set up, you can start performing statistical analysis in Excel using R. After importing your data into Excel, you can manipulate it using Excel’s built-in functions and formulas. When you need to perform advanced analyses, you can invoke R functions and packages directly from Excel using the RExcel add-in.
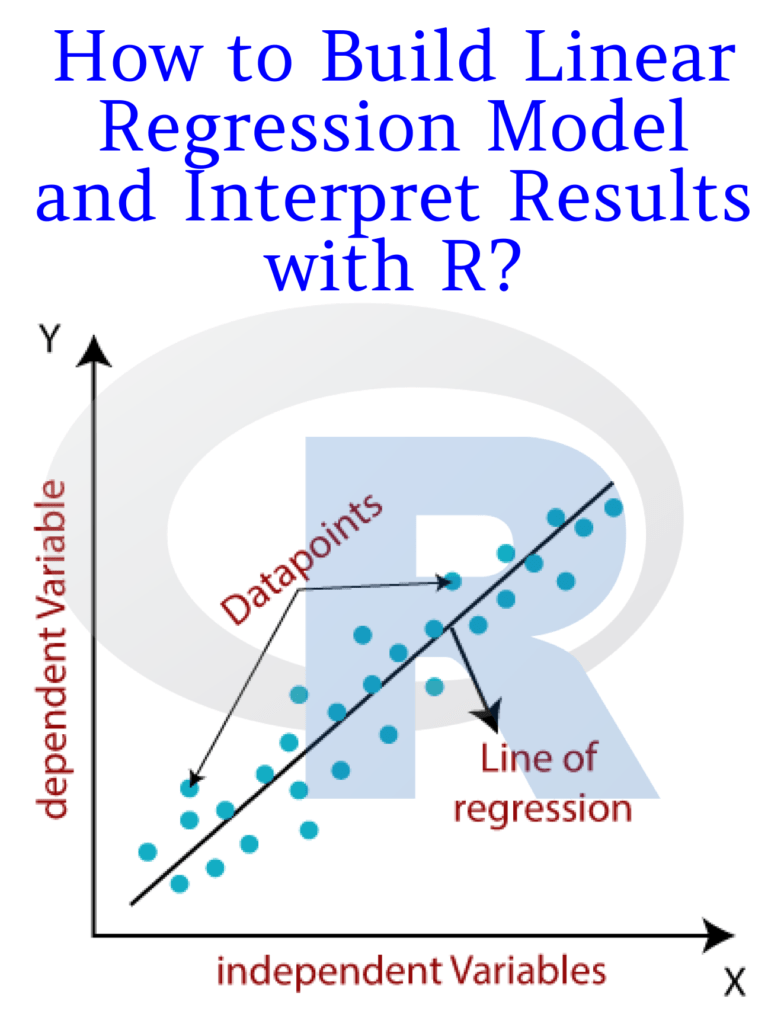
For example, you can use R’s statistical functions to generate descriptive statistics such as mean, standard deviation, and correlation coefficients. You can also conduct hypothesis tests, perform regression analysis, and build predictive models using R’s vast collection of statistical packages.
Creating Interactive Visualizations
R’s graphics capabilities can be seamlessly integrated into Excel using RExcel. This means you can create dynamic charts, plots, and visualizations using R’s powerful plotting functions. By combining Excel’s data manipulation features with R’s advanced visualization capabilities, you can generate insightful and interactive graphics to explore and communicate your data effectively.
Whether you need to create scatter plots, bar charts, histograms, or more complex visualizations, R’s graphics system provides extensive flexibility and customization options. You can use R code within Excel to define the aesthetics, labels, colors, and other properties of your visualizations, giving you full control over the presentation of your data.
Automating Tasks and Workflows
Another advantage is the ability to automate tasks and workflows. RExcel allows you to write R macros in Excel, enabling you to automate repetitive tasks, perform batch processing, and execute complex analyses with a single click. This automation can save significant time and effort, especially when dealing with large datasets or when running multiple analyses.
By combining the automation capabilities of R with Excel’s features like data validation, conditional formatting, and worksheet functions, you can create powerful workflows that streamline your data analysis processes. Whether it’s generating reports, updating analyses automatically, or integrating external data sources, the combination of R and Excel provides a robust platform for automation.
Case Study: Analyzing Sales Data
To illustrate the practical use, let’s consider a case study of analyzing sales data. Suppose you have a large dataset containing information about sales transactions, including customer details, product information, quantities sold, and revenue generated. By using R through Excel, you can perform various analyses on this dataset.
You can import the sales data into Excel, clean and preprocess it, and then use Excel’s formulas and functions to calculate additional metrics or derive new variables. Next, you can leverage R’s statistical functions to conduct exploratory data analysis, identify patterns, and uncover insights. With R’s graphical capabilities, you can create visualizations such as scatter plots, line charts, and box plots to visually explore the data.
By combining the power of R and Excel, you can create interactive visualizations that allow you to filter and drill down into specific segments of the data. This interactivity enhances data exploration and facilitates data-driven decision-making. By analyzing the sales data, you might discover trends, identify the most profitable products or customer segments, and make recommendations for optimizing sales strategies.
Limitations and Considerations
While this offers numerous benefits, there are some limitations and considerations to keep in mind. One limitation is the memory and performance constraints associated with running R within Excel. Large datasets or complex analyses may require substantial memory resources, and Excel’s performance can be affected when dealing with extensive computations.
Compatibility issues can also arise when using R through Excel. Certain Excel features, such as pivot tables or macros, may not be fully compatible with RExcel or may require additional configurations. It’s essential to be aware of these limitations and plan your analysis accordingly.
Another consideration is the learning curve for R beginners. Although RExcel provides a bridge between R and Excel, some familiarity with R programming is still necessary to take full advantage of its capabilities. Users new to R may need to invest time in learning R syntax, functions, and packages to effectively leverage its statistical power.
Download: Introduction To R For Excel