Python is a popular programming language for data analysis and visualization due to its versatility and a large number of libraries specifically designed for these tasks. Here are the basic steps to perform data analysis and visualization using Python:

- Import the required libraries: The most commonly used libraries for data analysis and visualization in Python are Pandas, Matplotlib, and Seaborn. You can import them using the following code:
import pandas as pd
import matplotlib.pyplot as plt
import seaborn as sns
- Load the data: Once the libraries are imported, you can load the data into a Pandas DataFrame. Pandas provides several functions to read data from different sources, such as CSV files, Excel files, SQL databases, etc. For example, to read a CSV file named ‘data.csv’, you can use the following code:
data = pd.read_csv('data.csv')
- Explore the data: Before visualizing the data, it is important to explore it to understand its structure and characteristics. You can use Pandas functions like
head(),tail(),describe(),info(), etc. to get a summary of the data.
print(data.head())
print(data.describe())
print(data.info())
- Clean the data: If the data contains missing or inconsistent values, you need to clean it before visualizing it. Pandas provides functions to handle missing values and outliers, such as
dropna(),fillna(),replace(), etc.
data.dropna(inplace=True) # remove rows with missing values
data.replace({'gender': {'M': 'Male', 'F': 'Female'}}, inplace=True) # replace inconsistent values
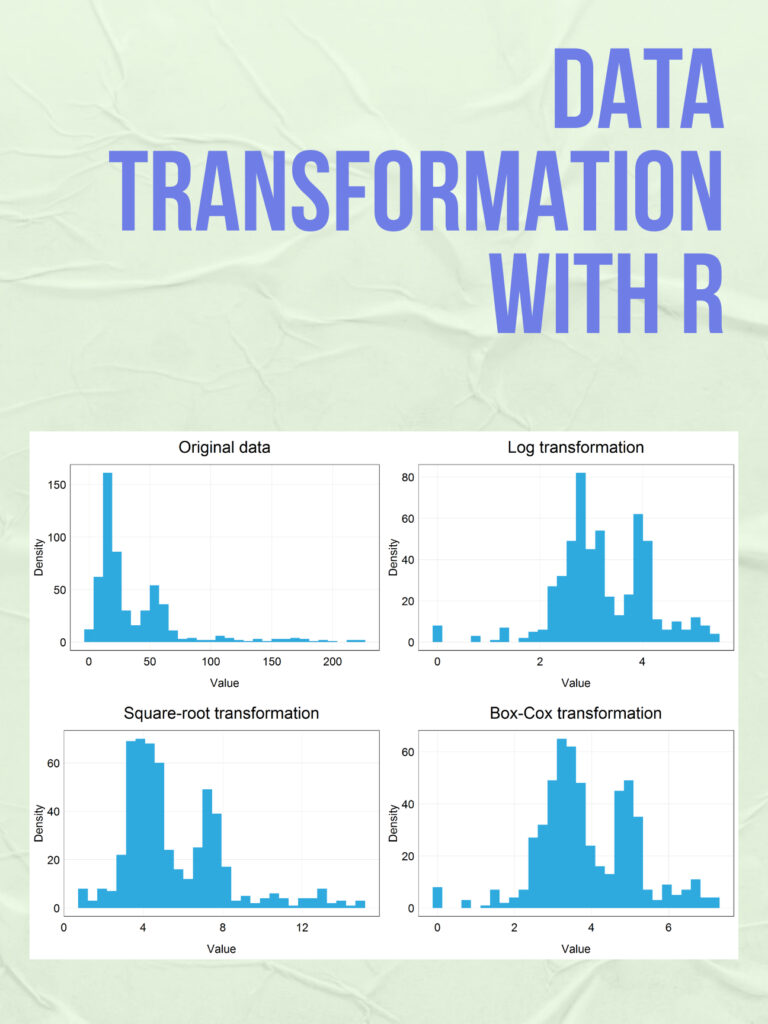
- Visualize the data: Once the data is cleaned and prepared, you can start visualizing it using Matplotlib and Seaborn. Matplotlib provides basic visualization functions like
plot(),scatter(),hist(), etc., while Seaborn provides more advanced functions for statistical data visualization, such asdistplot(),boxplot(),heatmap(), etc. Here’s an example of creating a histogram of age distribution using Seaborn:
sns.distplot(data['age'], bins=10)
plt.title('Age Distribution')
plt.xlabel('Age')
plt.ylabel('Density')
plt.show()
These are the basic steps of course, there are many more advanced techniques and libraries available, depending on your specific needs and goals.