Data analysis is a crucial step in the process of obtaining insights from data. Pandas, Matplotlib, and Python are three essential tools for data analysis. Together, they provide a comprehensive framework for data manipulation, exploration, and visualization. With these tools, you can perform complex data analysis tasks with ease and gain insights into your data that can inform business decisions.
Pandas is an open-source data manipulation library for Python that provides easy-to-use data structures and data analysis tools. Matplotlib is a plotting library for Python that is used for visualizing data and creating plots, charts, and graphs. Python, on the other hand, is a general-purpose programming language that is widely used for data analysis and scientific computing.
Getting started with Pandas:
To start using Pandas, you first need to install it by running the following command: pip install pandas. Once installed, you can import the library into your Python script by running the following command: import pandas as pd.
The first step in data analysis is to load the data into Pandas. This can be done using the pd.read_csv function, which reads data from a CSV file and returns a Pandas DataFrame. For example, to load a CSV file named data.csv into a DataFrame named df, you can run the following code:
df = pd.read_csv("data.csv")
Exploring the data using Pandas:
Once the data is loaded into a DataFrame, you can use various Pandas functions to explore the data. For example, to get a quick overview of the data, you can use the df.head function to display the first five rows of the data:
print(df.head())
You can also use the df.describe function to get summary statistics for the numerical columns in the data:
print(df.describe())
Visualizing the data using Matplotlib:
Matplotlib is a powerful plotting library for Python that can be used to create a variety of visualizations, such as line plots, scatter plots, bar plots, histograms, and more. To use Matplotlib, you first need to import the library into your Python script by running the following command: import matplotlib.pyplot as plt.
For example, to create a line plot of the y column against the x column, you can run the following code:
R Programming for Bioinformatics: Bioinformatics is a rapidly growing field that involves the use of computational tools to analyze large amounts of biological data. R is a powerful programming language that has become a popular choice for bioinformatics research due to its versatility and extensive libraries for data analysis, visualization, and statistical modeling. One of the primary advantages of using R for bioinformatics is its ability to handle large datasets with ease.
It can import, clean, manipulate, and visualize biological data from a variety of sources, including high-throughput sequencing, proteomics, and microarray experiments. R also provides a wide range of statistical analysis tools for exploring the relationships between biological variables, and for identifying patterns and trends in complex data. Here are some popular r packages for bioinformatics.
Bioconductor – a collection of R packages for analyzing and interpreting genomic data.
Biostrings – a package for handling sequence data, including DNA and RNA.
edgeR – a package for analyzing differential gene expression.
limma – a package for linear modeling of gene expression data.
Gviz – a package for visualizing genomic data.
ComplexHeatmap – a package for creating complex heatmaps of genomic data.
ChIPpeakAnno – a package for annotating ChIP-seq peaks.
SNPRelate – a package for analyzing SNP data.
GenomeGraphs – a package for creating interactive genome graphs.
These packages provide a range of tools for data analysis, visualization, and interpretation of genomic data. R programming provides a flexible and user-friendly environment for bioinformatics analysis and is widely used in the scientific community.
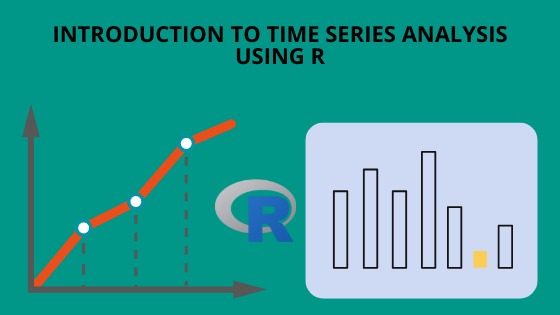
Introduction to Time Series Analysis using R: Time series analysis is a statistical method used to analyze time-based data and understand trends, patterns, and relationships over time. In R programming, several packages and functions are available for time series analysis. Some popular ones include “ts”, “zoo”, “xts”, and “forecast”.
Preparation
Before conducting a time series analysis, it is important to ensure that the data is properly formatted. A time series data should be in a format where the first column is the time index and each subsequent column is the value at that time point. Additionally, it is important to ensure that the time index is of a “ts” class, which is R’s native time series class. The following code demonstrates how to convert a data frame to a time series:
# Load library
library(zoo)

# Create example data frame
df <- data.frame(time = seq(as.Date("2010-01-01"), as.Date("2010-12-31"), "day"),
                 value = rnorm(365))

# Convert data frame to time series
ts_data <- zoo(df[,-1], order.by = df[,1])
Decomposition
Once the data is in the correct format, the next step is to decompose the time series into its components: trend, seasonality, and residuals. This allows a better understanding of the data and helps identify patterns or relationships. In R, the stl() function from the “stats” package can be used to perform a seasonal decomposition of time series data:
# Load library
library(stats)

# Decompose time series
decomposed_ts <- stl(ts_data, s.window = "periodic")
Forecasting is an important aspect of time series analysis and helps make predictions about future values. The forecast() function from the “forecast” package is widely used for time series forecasting in R. This function uses exponential smoothing models to make predictions:
# Load library
library(forecast)

# Forecast time series
forecast_ts <- forecast(ts_data, h = 365)
Conclusion
R is a powerful tool for time series analysis and provides many packages and functions for performing complex time series analysis. In this article, we have demonstrated the steps involved in converting a data frame to a time series, decomposing the time series into its components, and forecasting future values. With these tools, you will be well-equipped to perform time series analysis in R.
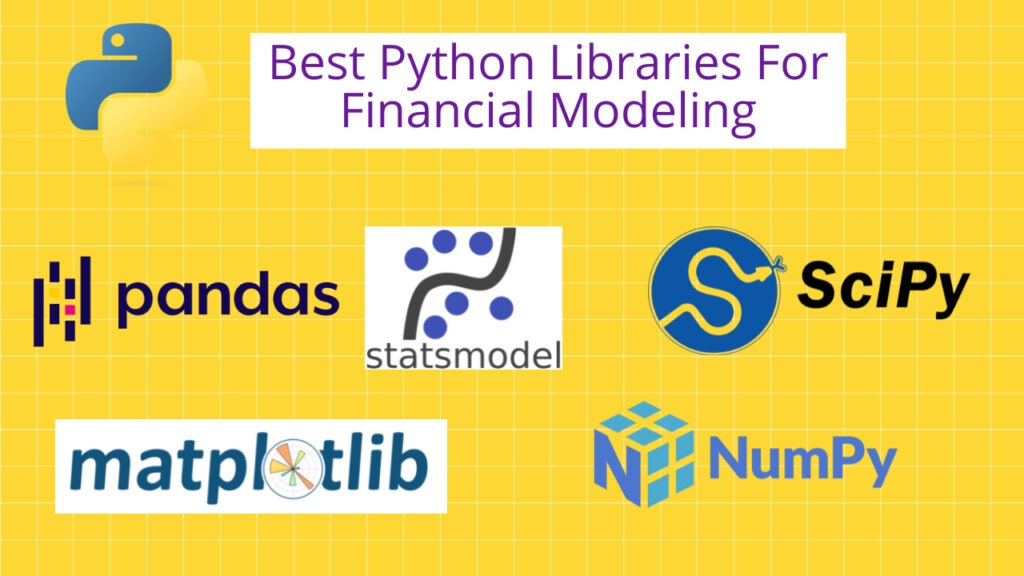
Best Python Libraries For Financial Modeling: The rise in the fintech industry amid coronavirus has increased globally. According to reports, over a billion dollar investment will be done in Fintech companies in the next 3–5 years. Python programming language is an excellent tool for developing new financial technologies. A wide range of software packages exists to help users build their own financial models, from crunching raw numbers to creating aesthetically pleasing, intuitive graphical user interfaces. This article provides a list of the best python packages and libraries used by finance professionals.
All financial models rely on crunching numbers. NumPy is the fundamental package for scientific computing with Python. It is a first-rate library for numerical programming and is widely used in academia, finance, and industry. NumPy specializes in basic array operations.
The panda’s library provides high-performance, easy-to-use data structures, and data analysis tools for the Python programming language. Pandas’ focus is on the fundamental data types and their methods, leaving other packages to add more sophisticated statistical functionality.
SciPy supplements the popular Numeric module, Numpy. It is a Python-based ecosystem of open-source software for mathematics, science, and engineering. It is also used intensively for scientific and financial computation based on Python. This package provides functions and algorithms critical to the advanced scientific computations needed to build any statistical model.
Pyfolio is a Python library for performance and risk analysis of financial portfolios. It works well with the Zipline open-source backtesting library. the pyfolio package provides an easy way to generate a tearsheet containing performance statistics. These statistics include annual/monthly returns, return quantiles, rolling beta/Sharpe ratios, portfolio turnover, and a few more.
The statsmodels package builds on these packages by implementing more advanced testing of different statistical models. An extensive list of result statistics and diagnostics for each estimator is available for any given model, with the goal of providing the user with a full picture of model performance. The results are tested against existing statistical packages to ensure that they are correct.
Zipline is a Pythonic algorithmic trading library. It is an event-driven system that supports both backtesting and live trading. It is a formidable algorithmic trading library for Python, evident by the fact that it powers Quantopian, a free platform for building and executing trading strategies.
It is an open-source python package that retrieves, analyses, and visualizes the data from stock market derivatives. With this library in hand, you can generate labels and features for machine learning models. To make this library work, it is advised to install numpy, pandas, and matplotlib or have any of these installed beforehand.
Financial data sources, optimal data structures, and statistical models and evaluation mechanisms for financial data are established by the aforementioned Python packages for finance. A crucial Python tool for financial modeling is data visualization, but none of them provides it.
Introduction to cleaning data with R: Cleaning data involves transforming raw data into consistent, easy-to-understand data. Data-driven statistical statements are filtered based on content and reliability based on the data. Moreover, it improves your data quality and overall productivity by influencing statistical statements based on the data.
Various steps are involved in this process, from the initial raw data to consistent and highly efficient data that can be implemented as per requirements and produce highly precise and accurate statistical results. Since the steps vary from data to data, the user should know which date he/she is using. Depending on the data used by the user for analysis, there are a number of characteristics and symptoms of messy data.
Special characters (e.g. commas in numeric values)
Numeric values stored as text/character data types
Duplicate rows
Misspellings
Inaccuracies
White space
Missing data
Zeros instead of null values vary.
Notes to the reader This tutorial is aimed at users who have some R programming experience. The reader is expected to be familiar with concepts such as variable assignment, vector, list, and data.frame, writing simple loops, and perhaps writing simple functions. The text will explain more complicated constructs when they are used.
Monetize your Data Science skills: Data science is without a doubt the most in-demand field today. No wonder data scientists with proficient skills are handsomely rewarded in jobs across the world. There are multiple interesting ways to make money from data science skills.
Monetize Your Data Science Skills
1. Write A Blog
Data science is new like every other technology! we love to read the content on websites. The opportunity is for you that there are very less resources in data science. Whatever is already present is good but data science fields lack some more quality content. Blogging is one of the most popular ways to share your findings with the world. There are so many ways to monetize blogs like Adsense, affiliates, etc. You may start to earn money from data science in this way as well.
2. Freelancing
You can start freelancing to monetize data science skills effectively through the power of the internet. You can work as much or as little as you want as a freelancer, giving you the freedom to advance at your own pace. There are many opportunities due to the rising demand for data science expertise. Freelancing is one of the top ways to monetize data science skills as a data scientist in 2023. There are multiple websites ( Upwork, Fiverr, and Freelance.) that provide sufficient and high-quality work for different professions with good payments, sometimes international payments.
3. Competing In Hackathons
You can put your data science skills to the test in high-stakes competitions such as Kaggle competitions. Active participation in Kaggle competitions, as well as global data science competitions, helps data scientists to improve their data science skills as well as earn good rewards. This will help to add some value to the CV of a data scientist to show communication skills, technical skills, as well as other data science skills.
4. Start A Consulting Firm
You can start with small projects with clearly defined goals. As a data science consultant, it will be your job to assist businesses in using data to solve issues and guide choices. This can entail everything from data analysis and model development to giving advice and producing documents. For this You must possess a strong foundation of data science knowledge and skills, as well as exceptional communication and problem-solving capabilities, to be effective.
5. Create Data Science Courses
One of the best ways to monetize your Data Science skills is to create data science courses for this, you must have experience in teaching and explaining technical concepts. You can Join online teaching platforms to work with them on instructing certain topics and courses. Create your own course and sell it on different platforms such as Udemy, teachable, Thinkific, Ruzuku, and LearnDash.
Data science courses are everywhere. You can watch free tutorials on YouTube, you can join online courses, or have formal data science education at university, but which one is the best option? After researching these highly-rated data science courses. At last, I understand there’s no single course/program that works for everybody, so in this article, I would like to share with you the pros and cons of each option based on my personal experience.
Highly Rated Data Science Courses
Criteria
The selections here are focused more on individuals getting started in data science, so I’ve filtered courses based on the following criteria:
The course goes over the entire data science process
The course uses popular open-source programming tools and libraries
The instructors cover the basic, most popular machine-learning algorithms
The course has a good combination of theory and application
The course needs to either be on-demand or available every month or so
There are hands-on assignments and projects
The instructors are engaging and personable
The course has excellent ratings – generally, greater than or equal to 4.5/5
1. Data Science Specialization — JHU Coursera
This course series is one of the most enrolled and highly rated course collections on this list. JHU did an incredible job with the balance of breadth and depth in the curriculum. One thing that’s included in this series that’s usually missing from many data science courses is a complete section on statistics, which is the backbone of data science.
Overall, the Data Science specialization is an ideal mix of theory and application using the R programming language. As far as prerequisites go, you should have some programming experience (doesn’t have to be R) and you have a good understanding of Algebra. Previous knowledge of Linear Algebra and/or Calculus isn’t necessary, but it is helpful.
2. Applied Data Science with Python Specialization — UMich Coursera
The University of Michigan, which also launched an online data science Master’s degree, produce this fantastic specialization focused on the applied side of data science. This means you’ll get a strong introduction to commonly used data science Python libraries, like matplotlib, pandas, nltk, scikit-learn, and networkx, and learn how to use them on real data.
This series doesn’t include the statistics needed for data science or the derivations of various machine learning algorithms but does provide a comprehensive breakdown of how to use and evaluate those algorithms in Python. Because of this, I think this would be more appropriate for someone that already knows R and/or is learning the statistical concepts elsewhere.
If you’re rusty with statistics, consider the Statistics with Python Specialization first. You’ll learn many of the most important statistical skills needed for data science.
Price – Free or $49/month for certificate and graded materials Provider – University of Michigan
3. Data Science MicroMasters — UC San Diego edX
MicroMasters from edX are advanced, graduate-level courses that count towards a real Master at select institutions. In the case of this MicroMaster’s, completing the courses and receiving a certificate will count as 30% of the full Master of Science in Data Science degree from Rochester Institute of Technology (RIT).
Since these courses are geared towards prospective Master’s students, the prerequisites are higher than many of the other courses on this list. Since the first course in this series doesn’t spend any time teaching basic Python concepts, you should already be comfortable with programming. Spending some time going through a platform like Treehouse would probably get you up to speed for the first course.
With a great mix of theory and application, this course from Harvard is one of the best for getting started as a beginner. It’s not on an interactive platform, like Coursera or edX, and doesn’t offer any sort of certification, but it’s definitely worth your time and it’s totally free.
5. Python for Data Science and Machine Learning Bootcamp — Udemy
Created by Andrew Ng, maker of the famous Stanford Machine Learning course, this is one of the highest-rated data science courses on the internet. This course series is for those interested in understanding and working with neural networks in Python.
How To Start With Data Science? There’s no doubt about it data science is in high demand. As of 2023, the average data scientist in the US makes over $113,000 a year, and data scientists in San Francisco make over $140,000. Learn data science and you could find yourself working in this promising, well-compensated field. Just thinking about the first step can leave you dazed and confused, especially if you lack previous experience in the field. With so many different data science careers to explore, you might find yourself wondering which is the right one for you and if you’ve got what it takes to fit the profile. Wondering how to start with Data Science. Start with this!
How To Start With Data Science Career 2023?
Is Data Science for Me? Well, we’ve all asked ourselves that question when we were at square one of our data science learning path. And we haven’t forgotten that every expert was once a beginner.
So, this data science career guide has a three-fold purpose:
Show you why data science opportunities are worth exploring;
Inform you about the different careers in data science and boost your efficiency in discovering suitable data science roles
Give you the know-how you need to pursue your professional data science path
So, what exactly is data science? It’s the process of asking interesting questions and then answering those questions using data. Generally speaking, the data science workflow looks like this:
Ask a question
Gather data that might help you to answer that question
Clean the data
Explore, analyze, and visualize the data
Build and evaluate a machine-learning model
Communicate results
This workflow doesn’t necessarily require advanced mathematics, deep learning mastery, or many other skills listed above. But it does require knowledge of a programming language and the ability to work withdata in that language. And although you need mathematical fluency to become really good at data science, you only need abasic understanding of mathematicsto get started.
Get comfortable with Python and R: Python and R are both great choices as programming languages for data science. R tends to be more popular in academia, and Python tends to be more popular in the industry, but both languages have a wealth of packages that support the data science workflow.
You don’t need to learn both Python and R to get started. Instead, you should focus on learning one language and its ecosystem of datascience packages. If you’ve chosen Python you may want to consider installing the Anaconda distribution because it simplifies the process of package installation and management on Windows, OSX, and Linux.
You also don’t need to become a Python expert to move on. Instead, you should focus on mastering the following: data types, data structures, imports, functions, conditional statements, comparisons, loops, and comprehensions. Everything else can wait until later!
Learn data analysis, manipulation, and visualization with pandas: For working with data in Python, you should learn how to use panda’s library. pandas provide a high-performance data structure (called a “DataFrame”) suitable for tabular data with columns of different types, similar to an Excel spreadsheet or SQL table. It includes tools for reading and writing data, handling missing data, filtering data, cleaning messy data, merging datasets, visualizing data, and so much more. In short, learning about pandas will significantly increase your efficiency when working with data.
However, pandas include an overwhelming amount of functionality, and (arguably) provide too many ways to accomplish the same task. Those characteristics can make it challenging to learn about pandas and discover best practices.
Focus on practical applications and not just theory: While undergoing courses and training, you should focus on the practical applications of things you are learning. This would help you not only understand the concept but also give you a deeper sense of how it would be applied in reality.
A few tips you should do when following a course:
Make sure you do all the exercises and assignments to understand the applications.
Work on a few open data sets and apply your learning. Even if you don’t understand the math behind a technique initially, understand the assumptions, what it does and how to interpret the results. You can constantly develop a deeper understanding at a later stage.
Take a look at the solutions by people who have worked in the field. They would be able to pinpoint you with the right approach faster.
Keep learning and practising: Here is my best advice for improving your data science skills: Find “the thing” that motivates you to practice what you learned and to learn more, and then do that thing. That could be personal data science projects, Kaggle competitions, online courses, reading books, reading blogs, attending meetups or conferences, or something else! Your data science journey has only begun! There is so much to learn in the field of data science that it would take more than a lifetime to master. Just remember: You don’t have to master it all to launch your data science career, you just have to get started!
Top 3 Free Online Courses for Data Science Certification: Learning about data science can seem very daunting, but many different online courses can help. Since the primary functions of data science are carried out online, it only makes sense that you learn about them online. Using Online Course Report’s exclusive methodology, we’ve searched high and low for the best no-fee courses for data science. The courses on the list below are all entirely free for students and are hosted by preeminent learning institutions and educational sites. If you have always been curious about data science and wondered whether or not you could do it, look no further than our list of these free online courses for data science certification.
Free Online Courses for Data Science Certification
IBM is perhaps the most prolific company in computer history and is undoubtedly a reputable resource from which to learn about data science. IBM has partnered with Coursera to create this data science specialization, which includes 9 courses that take approximately 11 months to fully complete. This is truly an in-depth look at data science that will fully prepare you to enter the IT world and start working. The courses within this specialization include topics like what exactly data science is, tools for data science, data science methodology, Python, databases and SQL, and data visualization. At the end of the specialization, you will also complete a capstone project that is designed to give you a sense of what real data scientists deal with in their everyday careers. Nearly 40 per cent of the students who completed this best free data science online program began a new career upon finishing, and you can earn a shareable certificate for free when you fully complete the specialization.
This selection of ten courses from Coursera will leave you fully prepared to take on a career in data science, all for free! More than 400,000 students have already enrolled in the course, and it has a 4.5 out of 5-star rating with more than 80,000 reviews. You have the option for a flexible schedule when you enrol in this specialization, meaning you can set your own deadlines for projects that work with your schedule. When you finish the coursework, you will also earn a shareable certificate that you can share on a resume or with employers. Throughout the free online course, you will delve into topics like GitHub, machine learning, R programming, regression analysis, data analysis, debugging, data manipulation, data cleansing, and cluster analysis. The specialization takes about 11 months to complete if you work at a pace of 7 hours a week, and it is taught by three professors from the John Hopkins University Bloomberg School of Public Health.
Everyone in the professional world is familiar with LinkedIn, as it is perhaps the most expansive and trusted professional networking site on the internet. Typically, the site operates on a subscription basis where users pay to access all of the site’s content. Luckily for you, they offer a 1-month free trial for new users where you can access the entirety of this specialization for free. Whether you have experience in IT or not, this data science specialization will help to prepare you for a new job. There are 8 learning items that make up more than 17 hours of content within the course, meaning you will do a deep dive on many important topics including data science fundamentals, statistics foundations, data governance, and data mining. At the end of the free online data science course, you will earn a certificate of achievement courtesy of LinkedIn, which can easily be shared with your profile.
Data Science: Free Online Courses For 2023: You don’t have to spend a fortune and study for years to start working with big data, analytics, and artificial intelligence. Demand for “armchair data scientists” those without formal qualifications in the subject but with the skills and knowledge to analyze data in their everyday work, is predicted to outstrip demand for traditionally qualified data scientists in the coming years.
With so many courses available, you can compare and choose the best for your requirement and also use these platforms to connect with people who may have taken the course before. Although the courses in this list are long, we have collated some of the top online data science courses that must have slipped under your radar.
Designed to give a “fluff-free” overview of what data science is, how it works, and what it can be used to do. This course offers an introduction to the technical side of data science but is particularly aimed at understanding the “big picture” for those who need to manage data scientists or data science work. It’s a relatively short course consisting of just one module that can be completed in under a week and serves as a great introduction for those who want to learn the terminology and understand how to build a data science strategy, without necessarily needing detailed instructions on using the technical tools involved.
A completely free course that breaks down the core topics of the data science process and an introduction to machine learning into three modules, each designed to take around three hours to complete, and concluding with an assessment. Once you’ve worked through that, you can choose from several other similarly bite-sized tutorials covering data programming languages, visualization tools, and techniques such as building clustering and regression models.
This course, aimed at those wanting to improve their career prospects with a mix of practical and theoretical knowledge, walks you through core concepts and terminology, statistical techniques such as regression, clustering, and classification, and the practical steps needed to build and evaluate models.
Although primarily a paid-for platform offering proprietary content, Dataquest offers a number of free introductory modules to anyone who signs up, covering essential topics such as working with data, visualizing data, data mining and constructing algorithms in Python and R. If you want the full, ad-free experience and certification there are monthly subscription options, there’s more than enough information to get started free of charge.
All of the class materials and lectures for Harvard’s data science course are made freely available online, so they can be studied at your own pace. You may not end up with a degree from one of the world’s most prestigious universities, but the course is detailed and technical enough to make an expert of you by the end. The course is part of a data science degree and constructed for students who have prior knowledge of, or are also studying, core fields such as programming, maths, and statistics. However, there are enough free resources out there on those subjects to make this a viable option for that outside of academia, if you are dedicated enough.
Those wanting to get their hands dirty with some actual coding will soon find out that Python is one of the most commonly used programming languages in the field and for good reason. It’s relatively simple to learn the basics and can be combined with a number of free, open-source libraries to perform hugely powerful data science operations. This course serves as a first step along the road, introducing Python functions that are used to prepare and manipulate big datasets as well as the proven techniques for extracting insights from data. It is intended to be completed by spending between three and six hours per week studying or working on exercises, over four weeks.
This course led by an established expert in R and data analytics is the first in an in-depth, ten-part tutorial on expert R programming, but also stands on its own as an introduction to the language and a primer on the basics as they relate to data science. Like Python, R is a totally free and open-source language and environment that has become an accepted standard among data scientists due to its power and flexibility. This course consists of 10 lectures delivered across eight hours of video and is completely free to follow.
This is one of the most highly-rated of Udemy’s introductory courses on the subjects of data science and coding in Python. It does not require any previous knowledge or experience as it starts right from the basics. However, unlike some other very entry-level courses, it does progress to some actual practical instruction in Python and, particularly usefully, its Sci-Kit Learn framework, a very popular tool for academic and enterprise-level data exploration and mining.
Along with maths and computer science, statistics is one of the fundamental academic disciplines invoked by those working on projects involving data science and analytics. If you are completely new to the subject, this course offers a non-technical grounding covering basic and some advanced principles and techniques that will certainly help anyone trying to get their head around the wider field of data science.
If you want to truly understand data science then at some point you are going to come up against the field of statistics and probability, which can certainly be baffling for newcomers, particularly if your formal education days ended some time ago and what you did learn about the subject at school is a dim memory. This course explains how the statistical approach is used to make sense of the information that’s everywhere in the world around us.